Israeli vs Macedonian Receiving Food Stamps
COMPARE
Israeli
Macedonian
Receiving Food Stamps
Receiving Food Stamps Comparison
Israelis
Macedonians
10.7%
RECEIVING FOOD STAMPS
92.4/ 100
METRIC RATING
130th/ 347
METRIC RANK
9.9%
RECEIVING FOOD STAMPS
98.9/ 100
METRIC RATING
73rd/ 347
METRIC RANK
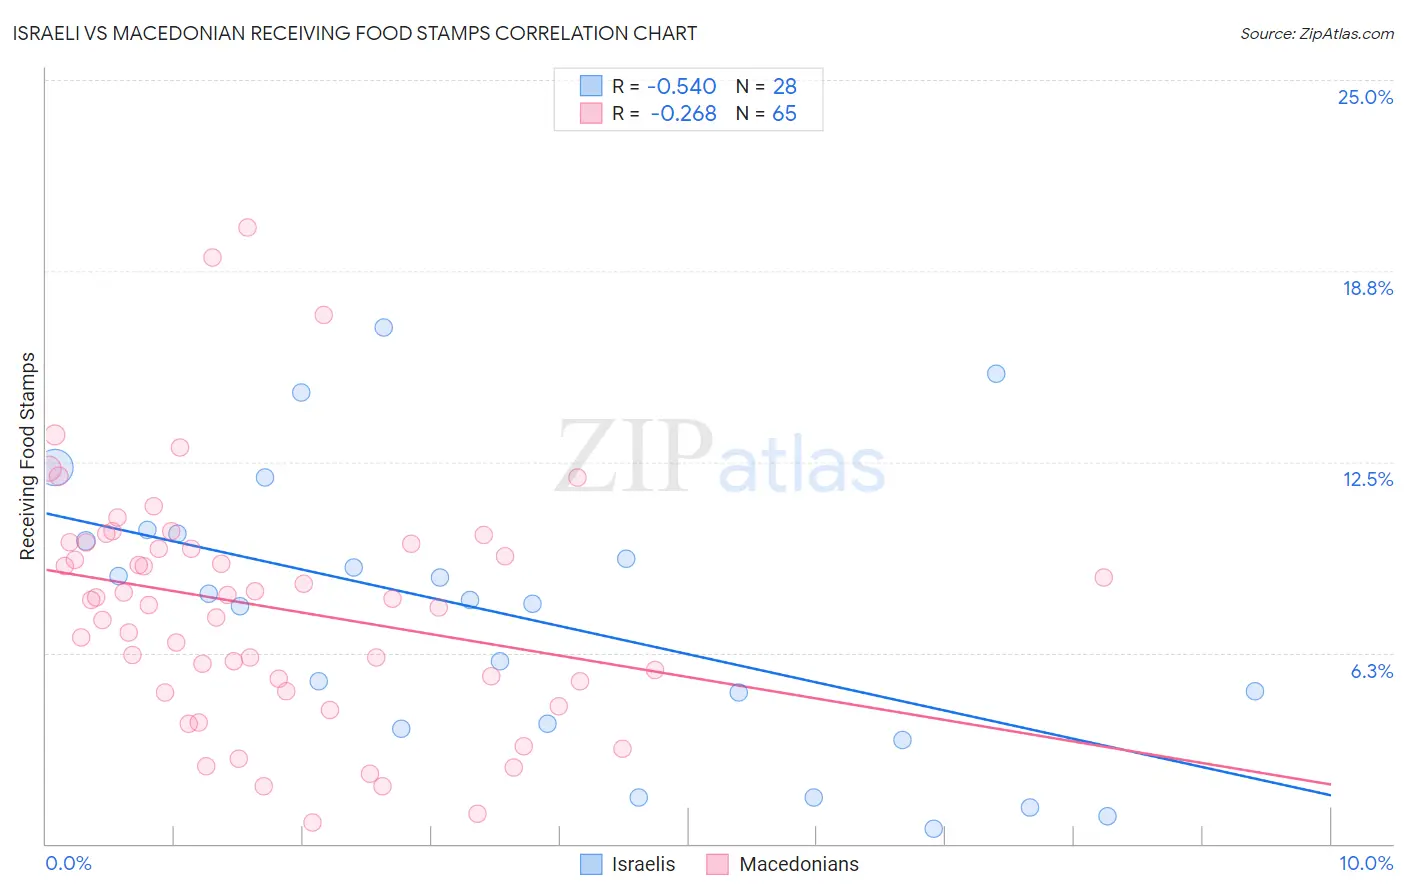
Israeli vs Macedonian Receiving Food Stamps Correlation Chart
The statistical analysis conducted on geographies consisting of 210,490,548 people shows a substantial negative correlation between the proportion of Israelis and percentage of population receiving government assistance and/or food stamps in the United States with a correlation coefficient (R) of -0.540 and weighted average of 10.7%. Similarly, the statistical analysis conducted on geographies consisting of 132,449,989 people shows a weak negative correlation between the proportion of Macedonians and percentage of population receiving government assistance and/or food stamps in the United States with a correlation coefficient (R) of -0.268 and weighted average of 9.9%, a difference of 8.2%.
Receiving Food Stamps Correlation Summary
| Measurement | Israeli | Macedonian |
| Minimum | 0.50% | 0.70% |
| Maximum | 16.9% | 20.2% |
| Range | 16.4% | 19.5% |
| Mean | 7.4% | 7.7% |
| Median | 7.9% | 8.0% |
| Interquartile 25% (IQ1) | 3.9% | 5.1% |
| Interquartile 75% (IQ3) | 10.0% | 9.8% |
| Interquartile Range (IQR) | 6.2% | 4.7% |
| Standard Deviation (Sample) | 4.5% | 3.9% |
| Standard Deviation (Population) | 4.4% | 3.9% |
Similar Demographics by Receiving Food Stamps
Demographics Similar to Israelis by Receiving Food Stamps
In terms of receiving food stamps, the demographic groups most similar to Israelis are French (10.7%, a difference of 0.0%), Immigrants from Jordan (10.7%, a difference of 0.10%), Yugoslavian (10.7%, a difference of 0.10%), Immigrants from Ethiopia (10.7%, a difference of 0.11%), and Afghan (10.7%, a difference of 0.13%).
| Demographics | Rating | Rank | Receiving Food Stamps |
| Immigrants | Philippines | 93.3 /100 | #123 | Exceptional 10.7% |
| Paraguayans | 93.0 /100 | #124 | Exceptional 10.7% |
| Ukrainians | 92.8 /100 | #125 | Exceptional 10.7% |
| Afghans | 92.6 /100 | #126 | Exceptional 10.7% |
| Immigrants | Ethiopia | 92.6 /100 | #127 | Exceptional 10.7% |
| Immigrants | Jordan | 92.5 /100 | #128 | Exceptional 10.7% |
| Yugoslavians | 92.5 /100 | #129 | Exceptional 10.7% |
| Israelis | 92.4 /100 | #130 | Exceptional 10.7% |
| French | 92.3 /100 | #131 | Exceptional 10.7% |
| Immigrants | Germany | 92.0 /100 | #132 | Exceptional 10.7% |
| Immigrants | Russia | 90.9 /100 | #133 | Exceptional 10.8% |
| Immigrants | Brazil | 90.3 /100 | #134 | Exceptional 10.8% |
| Argentineans | 90.2 /100 | #135 | Exceptional 10.8% |
| Slovaks | 89.8 /100 | #136 | Excellent 10.8% |
| Immigrants | Eastern Europe | 89.8 /100 | #137 | Excellent 10.8% |
Demographics Similar to Macedonians by Receiving Food Stamps
In terms of receiving food stamps, the demographic groups most similar to Macedonians are Immigrants from Asia (9.9%, a difference of 0.060%), New Zealander (9.9%, a difference of 0.16%), Scottish (9.9%, a difference of 0.30%), Immigrants from Serbia (9.9%, a difference of 0.44%), and Immigrants from Zimbabwe (9.9%, a difference of 0.45%).
| Demographics | Rating | Rank | Receiving Food Stamps |
| Slovenes | 99.1 /100 | #66 | Exceptional 9.8% |
| Immigrants | Indonesia | 99.0 /100 | #67 | Exceptional 9.8% |
| Northern Europeans | 99.0 /100 | #68 | Exceptional 9.8% |
| Italians | 99.0 /100 | #69 | Exceptional 9.9% |
| Immigrants | Serbia | 99.0 /100 | #70 | Exceptional 9.9% |
| Scottish | 98.9 /100 | #71 | Exceptional 9.9% |
| Immigrants | Asia | 98.9 /100 | #72 | Exceptional 9.9% |
| Macedonians | 98.9 /100 | #73 | Exceptional 9.9% |
| New Zealanders | 98.8 /100 | #74 | Exceptional 9.9% |
| Immigrants | Zimbabwe | 98.7 /100 | #75 | Exceptional 9.9% |
| Immigrants | Croatia | 98.7 /100 | #76 | Exceptional 10.0% |
| Immigrants | North Macedonia | 98.7 /100 | #77 | Exceptional 10.0% |
| South Africans | 98.7 /100 | #78 | Exceptional 10.0% |
| Laotians | 98.7 /100 | #79 | Exceptional 10.0% |
| Poles | 98.6 /100 | #80 | Exceptional 10.0% |