Israeli vs Barbadian Receiving Food Stamps
COMPARE
Israeli
Barbadian
Receiving Food Stamps
Receiving Food Stamps Comparison
Israelis
Barbadians
10.7%
RECEIVING FOOD STAMPS
92.4/ 100
METRIC RATING
130th/ 347
METRIC RANK
16.5%
RECEIVING FOOD STAMPS
0.0/ 100
METRIC RATING
308th/ 347
METRIC RANK
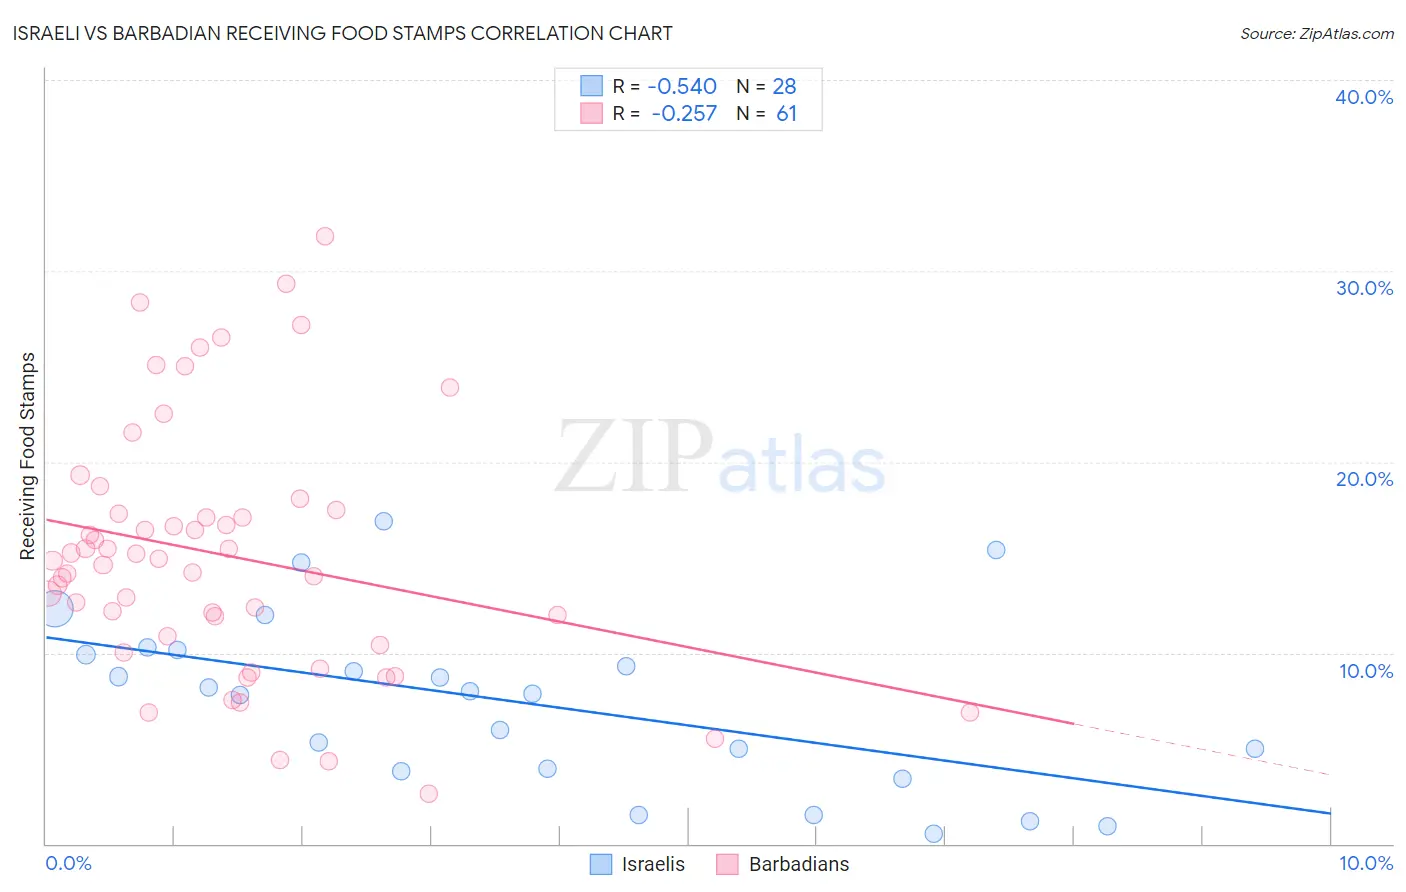
Israeli vs Barbadian Receiving Food Stamps Correlation Chart
The statistical analysis conducted on geographies consisting of 210,490,548 people shows a substantial negative correlation between the proportion of Israelis and percentage of population receiving government assistance and/or food stamps in the United States with a correlation coefficient (R) of -0.540 and weighted average of 10.7%. Similarly, the statistical analysis conducted on geographies consisting of 141,159,884 people shows a weak negative correlation between the proportion of Barbadians and percentage of population receiving government assistance and/or food stamps in the United States with a correlation coefficient (R) of -0.257 and weighted average of 16.5%, a difference of 54.0%.
Receiving Food Stamps Correlation Summary
| Measurement | Israeli | Barbadian |
| Minimum | 0.50% | 2.6% |
| Maximum | 16.9% | 31.8% |
| Range | 16.4% | 29.2% |
| Mean | 7.4% | 15.1% |
| Median | 7.9% | 14.8% |
| Interquartile 25% (IQ1) | 3.9% | 10.6% |
| Interquartile 75% (IQ3) | 10.0% | 17.4% |
| Interquartile Range (IQR) | 6.2% | 6.8% |
| Standard Deviation (Sample) | 4.5% | 6.5% |
| Standard Deviation (Population) | 4.4% | 6.5% |
Similar Demographics by Receiving Food Stamps
Demographics Similar to Israelis by Receiving Food Stamps
In terms of receiving food stamps, the demographic groups most similar to Israelis are French (10.7%, a difference of 0.0%), Immigrants from Jordan (10.7%, a difference of 0.10%), Yugoslavian (10.7%, a difference of 0.10%), Immigrants from Ethiopia (10.7%, a difference of 0.11%), and Afghan (10.7%, a difference of 0.13%).
| Demographics | Rating | Rank | Receiving Food Stamps |
| Immigrants | Philippines | 93.3 /100 | #123 | Exceptional 10.7% |
| Paraguayans | 93.0 /100 | #124 | Exceptional 10.7% |
| Ukrainians | 92.8 /100 | #125 | Exceptional 10.7% |
| Afghans | 92.6 /100 | #126 | Exceptional 10.7% |
| Immigrants | Ethiopia | 92.6 /100 | #127 | Exceptional 10.7% |
| Immigrants | Jordan | 92.5 /100 | #128 | Exceptional 10.7% |
| Yugoslavians | 92.5 /100 | #129 | Exceptional 10.7% |
| Israelis | 92.4 /100 | #130 | Exceptional 10.7% |
| French | 92.3 /100 | #131 | Exceptional 10.7% |
| Immigrants | Germany | 92.0 /100 | #132 | Exceptional 10.7% |
| Immigrants | Russia | 90.9 /100 | #133 | Exceptional 10.8% |
| Immigrants | Brazil | 90.3 /100 | #134 | Exceptional 10.8% |
| Argentineans | 90.2 /100 | #135 | Exceptional 10.8% |
| Slovaks | 89.8 /100 | #136 | Excellent 10.8% |
| Immigrants | Eastern Europe | 89.8 /100 | #137 | Excellent 10.8% |
Demographics Similar to Barbadians by Receiving Food Stamps
In terms of receiving food stamps, the demographic groups most similar to Barbadians are U.S. Virgin Islander (16.5%, a difference of 0.24%), Houma (16.5%, a difference of 0.26%), Jamaican (16.4%, a difference of 0.55%), Immigrants from the Azores (16.4%, a difference of 0.62%), and Immigrants from Barbados (16.6%, a difference of 0.79%).
| Demographics | Rating | Rank | Receiving Food Stamps |
| Trinidadians and Tobagonians | 0.0 /100 | #301 | Tragic 16.0% |
| Immigrants | West Indies | 0.0 /100 | #302 | Tragic 16.1% |
| Nicaraguans | 0.0 /100 | #303 | Tragic 16.1% |
| West Indians | 0.0 /100 | #304 | Tragic 16.3% |
| Immigrants | Azores | 0.0 /100 | #305 | Tragic 16.4% |
| Jamaicans | 0.0 /100 | #306 | Tragic 16.4% |
| Houma | 0.0 /100 | #307 | Tragic 16.5% |
| Barbadians | 0.0 /100 | #308 | Tragic 16.5% |
| U.S. Virgin Islanders | 0.0 /100 | #309 | Tragic 16.5% |
| Immigrants | Barbados | 0.0 /100 | #310 | Tragic 16.6% |
| Guyanese | 0.0 /100 | #311 | Tragic 16.7% |
| Sioux | 0.0 /100 | #312 | Tragic 16.8% |
| Immigrants | Jamaica | 0.0 /100 | #313 | Tragic 16.9% |
| Immigrants | Guyana | 0.0 /100 | #314 | Tragic 16.9% |
| Bahamians | 0.0 /100 | #315 | Tragic 17.0% |