Iroquois vs Paraguayan Poverty
COMPARE
Iroquois
Paraguayan
Poverty
Poverty Comparison
Iroquois
Paraguayans
14.5%
POVERTY
0.1/ 100
METRIC RATING
267th/ 347
METRIC RANK
11.4%
POVERTY
94.9/ 100
METRIC RATING
94th/ 347
METRIC RANK
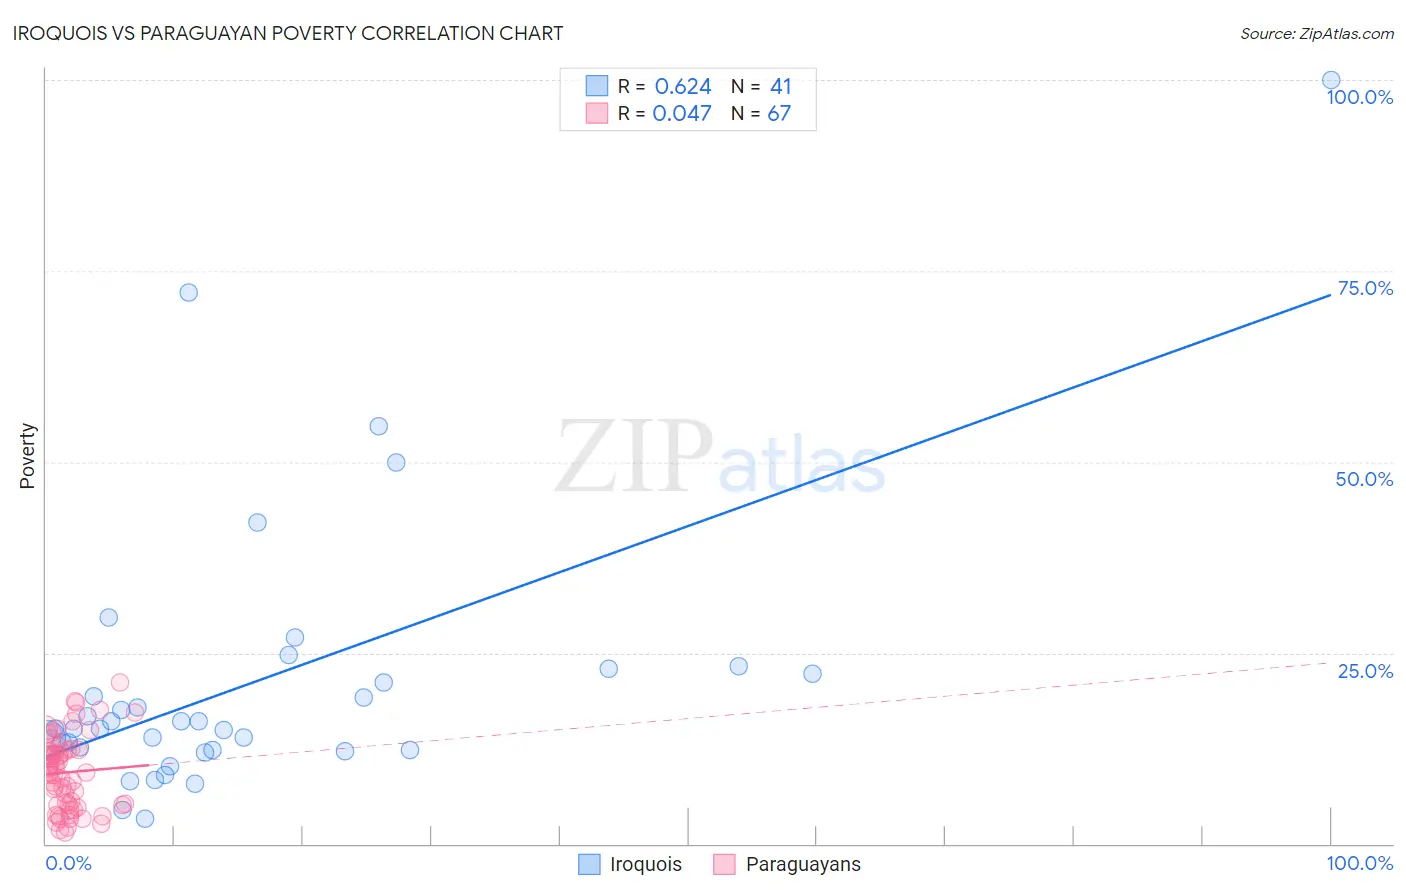
Iroquois vs Paraguayan Poverty Correlation Chart
The statistical analysis conducted on geographies consisting of 207,260,268 people shows a significant positive correlation between the proportion of Iroquois and poverty level in the United States with a correlation coefficient (R) of 0.624 and weighted average of 14.5%. Similarly, the statistical analysis conducted on geographies consisting of 95,102,151 people shows no correlation between the proportion of Paraguayans and poverty level in the United States with a correlation coefficient (R) of 0.047 and weighted average of 11.4%, a difference of 26.9%.
Poverty Correlation Summary
| Measurement | Iroquois | Paraguayan |
| Minimum | 3.3% | 1.5% |
| Maximum | 100.0% | 21.1% |
| Range | 96.7% | 19.6% |
| Mean | 21.2% | 9.4% |
| Median | 15.1% | 9.4% |
| Interquartile 25% (IQ1) | 12.3% | 5.1% |
| Interquartile 75% (IQ3) | 22.6% | 12.2% |
| Interquartile Range (IQR) | 10.3% | 7.2% |
| Standard Deviation (Sample) | 18.5% | 4.8% |
| Standard Deviation (Population) | 18.3% | 4.8% |
Similar Demographics by Poverty
Demographics Similar to Iroquois by Poverty
In terms of poverty, the demographic groups most similar to Iroquois are Subsaharan African (14.5%, a difference of 0.040%), Immigrants from Cuba (14.6%, a difference of 0.19%), Guyanese (14.5%, a difference of 0.32%), Central American (14.6%, a difference of 0.33%), and Immigrants from Guyana (14.5%, a difference of 0.49%).
| Demographics | Rating | Rank | Poverty |
| Cape Verdeans | 0.1 /100 | #260 | Tragic 14.4% |
| Cherokee | 0.1 /100 | #261 | Tragic 14.4% |
| Immigrants | Liberia | 0.1 /100 | #262 | Tragic 14.4% |
| Jamaicans | 0.1 /100 | #263 | Tragic 14.4% |
| Immigrants | Jamaica | 0.1 /100 | #264 | Tragic 14.4% |
| Immigrants | Guyana | 0.1 /100 | #265 | Tragic 14.5% |
| Guyanese | 0.1 /100 | #266 | Tragic 14.5% |
| Iroquois | 0.1 /100 | #267 | Tragic 14.5% |
| Sub-Saharan Africans | 0.1 /100 | #268 | Tragic 14.5% |
| Immigrants | Cuba | 0.1 /100 | #269 | Tragic 14.6% |
| Central Americans | 0.1 /100 | #270 | Tragic 14.6% |
| Shoshone | 0.0 /100 | #271 | Tragic 14.7% |
| Chickasaw | 0.0 /100 | #272 | Tragic 14.7% |
| Spanish Americans | 0.0 /100 | #273 | Tragic 14.7% |
| Barbadians | 0.0 /100 | #274 | Tragic 14.8% |
Demographics Similar to Paraguayans by Poverty
In terms of poverty, the demographic groups most similar to Paraguayans are Australian (11.4%, a difference of 0.0%), Romanian (11.4%, a difference of 0.020%), British (11.4%, a difference of 0.060%), Immigrants from South Africa (11.5%, a difference of 0.12%), and Immigrants from Egypt (11.5%, a difference of 0.16%).
| Demographics | Rating | Rank | Poverty |
| Northern Europeans | 96.0 /100 | #87 | Exceptional 11.4% |
| Belgians | 95.8 /100 | #88 | Exceptional 11.4% |
| Czechoslovakians | 95.7 /100 | #89 | Exceptional 11.4% |
| Immigrants | Denmark | 95.5 /100 | #90 | Exceptional 11.4% |
| Finns | 95.2 /100 | #91 | Exceptional 11.4% |
| British | 95.0 /100 | #92 | Exceptional 11.4% |
| Romanians | 94.9 /100 | #93 | Exceptional 11.4% |
| Paraguayans | 94.9 /100 | #94 | Exceptional 11.4% |
| Australians | 94.9 /100 | #95 | Exceptional 11.4% |
| Immigrants | South Africa | 94.7 /100 | #96 | Exceptional 11.5% |
| Immigrants | Egypt | 94.6 /100 | #97 | Exceptional 11.5% |
| Immigrants | Latvia | 94.5 /100 | #98 | Exceptional 11.5% |
| Immigrants | Indonesia | 94.2 /100 | #99 | Exceptional 11.5% |
| Scottish | 94.0 /100 | #100 | Exceptional 11.5% |
| Slavs | 93.3 /100 | #101 | Exceptional 11.5% |