Iroquois vs Immigrants from Congo Poverty
COMPARE
Iroquois
Immigrants from Congo
Poverty
Poverty Comparison
Iroquois
Immigrants from Congo
14.5%
POVERTY
0.1/ 100
METRIC RATING
267th/ 347
METRIC RANK
16.1%
POVERTY
0.0/ 100
METRIC RATING
319th/ 347
METRIC RANK
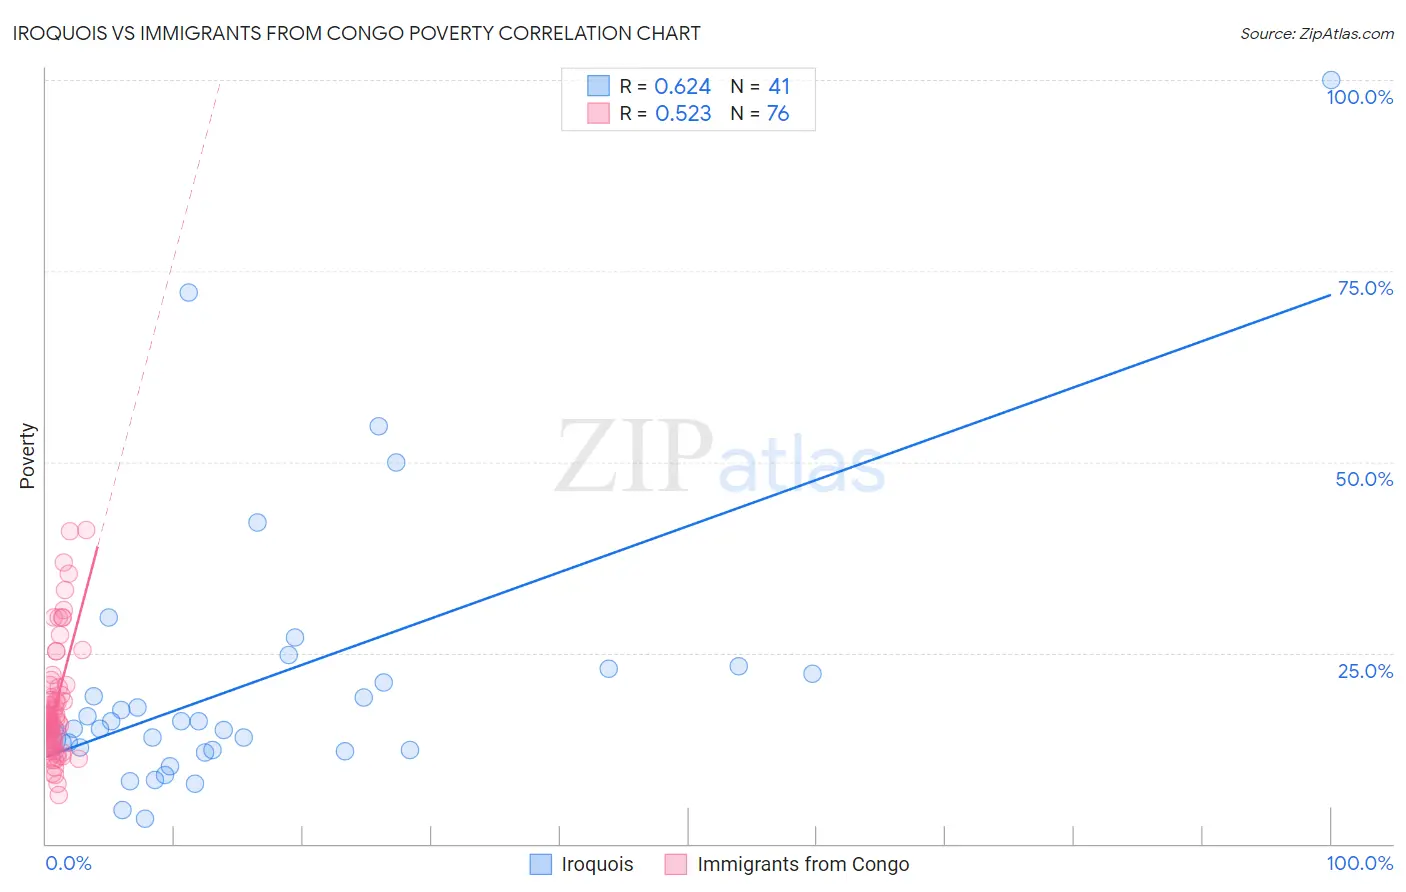
Iroquois vs Immigrants from Congo Poverty Correlation Chart
The statistical analysis conducted on geographies consisting of 207,260,268 people shows a significant positive correlation between the proportion of Iroquois and poverty level in the United States with a correlation coefficient (R) of 0.624 and weighted average of 14.5%. Similarly, the statistical analysis conducted on geographies consisting of 92,094,185 people shows a substantial positive correlation between the proportion of Immigrants from Congo and poverty level in the United States with a correlation coefficient (R) of 0.523 and weighted average of 16.1%, a difference of 11.0%.
Poverty Correlation Summary
| Measurement | Iroquois | Immigrants from Congo |
| Minimum | 3.3% | 6.3% |
| Maximum | 100.0% | 41.0% |
| Range | 96.7% | 34.7% |
| Mean | 21.2% | 18.1% |
| Median | 15.1% | 16.1% |
| Interquartile 25% (IQ1) | 12.3% | 13.3% |
| Interquartile 75% (IQ3) | 22.6% | 20.0% |
| Interquartile Range (IQR) | 10.3% | 6.7% |
| Standard Deviation (Sample) | 18.5% | 7.4% |
| Standard Deviation (Population) | 18.3% | 7.4% |
Similar Demographics by Poverty
Demographics Similar to Iroquois by Poverty
In terms of poverty, the demographic groups most similar to Iroquois are Subsaharan African (14.5%, a difference of 0.040%), Immigrants from Cuba (14.6%, a difference of 0.19%), Guyanese (14.5%, a difference of 0.32%), Central American (14.6%, a difference of 0.33%), and Immigrants from Guyana (14.5%, a difference of 0.49%).
| Demographics | Rating | Rank | Poverty |
| Cape Verdeans | 0.1 /100 | #260 | Tragic 14.4% |
| Cherokee | 0.1 /100 | #261 | Tragic 14.4% |
| Immigrants | Liberia | 0.1 /100 | #262 | Tragic 14.4% |
| Jamaicans | 0.1 /100 | #263 | Tragic 14.4% |
| Immigrants | Jamaica | 0.1 /100 | #264 | Tragic 14.4% |
| Immigrants | Guyana | 0.1 /100 | #265 | Tragic 14.5% |
| Guyanese | 0.1 /100 | #266 | Tragic 14.5% |
| Iroquois | 0.1 /100 | #267 | Tragic 14.5% |
| Sub-Saharan Africans | 0.1 /100 | #268 | Tragic 14.5% |
| Immigrants | Cuba | 0.1 /100 | #269 | Tragic 14.6% |
| Central Americans | 0.1 /100 | #270 | Tragic 14.6% |
| Shoshone | 0.0 /100 | #271 | Tragic 14.7% |
| Chickasaw | 0.0 /100 | #272 | Tragic 14.7% |
| Spanish Americans | 0.0 /100 | #273 | Tragic 14.7% |
| Barbadians | 0.0 /100 | #274 | Tragic 14.8% |
Demographics Similar to Immigrants from Congo by Poverty
In terms of poverty, the demographic groups most similar to Immigrants from Congo are Immigrants from Dominica (16.1%, a difference of 0.20%), Immigrants from Honduras (16.2%, a difference of 0.23%), U.S. Virgin Islander (16.1%, a difference of 0.49%), Arapaho (16.3%, a difference of 0.97%), and Honduran (15.9%, a difference of 1.7%).
| Demographics | Rating | Rank | Poverty |
| Cajuns | 0.0 /100 | #312 | Tragic 15.7% |
| Immigrants | Grenada | 0.0 /100 | #313 | Tragic 15.8% |
| Immigrants | Somalia | 0.0 /100 | #314 | Tragic 15.8% |
| British West Indians | 0.0 /100 | #315 | Tragic 15.9% |
| Hondurans | 0.0 /100 | #316 | Tragic 15.9% |
| U.S. Virgin Islanders | 0.0 /100 | #317 | Tragic 16.1% |
| Immigrants | Dominica | 0.0 /100 | #318 | Tragic 16.1% |
| Immigrants | Congo | 0.0 /100 | #319 | Tragic 16.1% |
| Immigrants | Honduras | 0.0 /100 | #320 | Tragic 16.2% |
| Arapaho | 0.0 /100 | #321 | Tragic 16.3% |
| Menominee | 0.0 /100 | #322 | Tragic 16.4% |
| Colville | 0.0 /100 | #323 | Tragic 16.6% |
| Yakama | 0.0 /100 | #324 | Tragic 16.7% |
| Central American Indians | 0.0 /100 | #325 | Tragic 16.7% |
| Paiute | 0.0 /100 | #326 | Tragic 16.7% |