Iroquois vs Mongolian Receiving Food Stamps
COMPARE
Iroquois
Mongolian
Receiving Food Stamps
Receiving Food Stamps Comparison
Iroquois
Mongolians
13.5%
RECEIVING FOOD STAMPS
1.2/ 100
METRIC RATING
240th/ 347
METRIC RANK
10.5%
RECEIVING FOOD STAMPS
95.8/ 100
METRIC RATING
112th/ 347
METRIC RANK
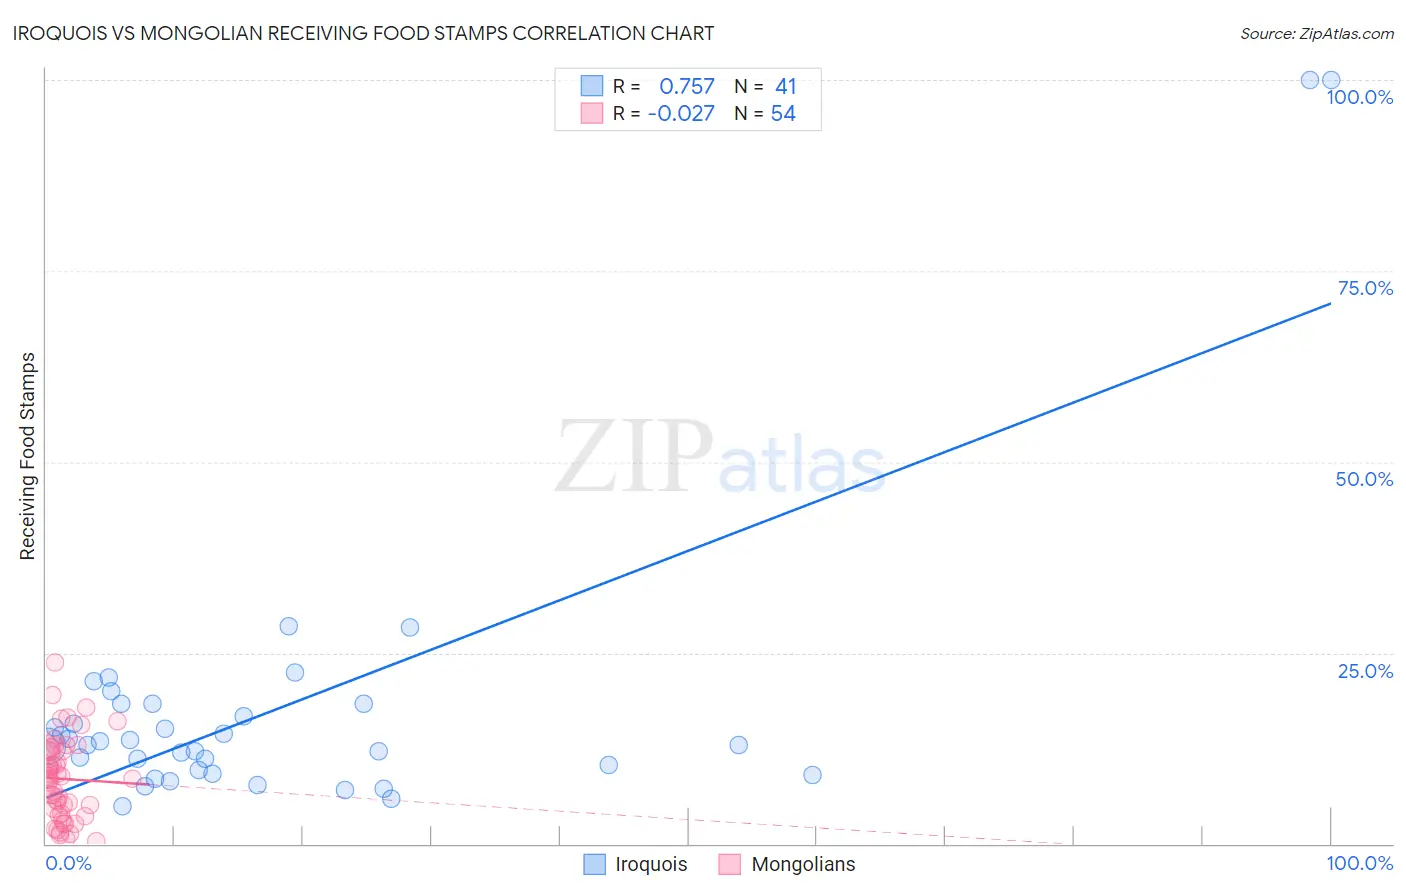
Iroquois vs Mongolian Receiving Food Stamps Correlation Chart
The statistical analysis conducted on geographies consisting of 207,071,964 people shows a strong positive correlation between the proportion of Iroquois and percentage of population receiving government assistance and/or food stamps in the United States with a correlation coefficient (R) of 0.757 and weighted average of 13.5%. Similarly, the statistical analysis conducted on geographies consisting of 140,177,644 people shows no correlation between the proportion of Mongolians and percentage of population receiving government assistance and/or food stamps in the United States with a correlation coefficient (R) of -0.027 and weighted average of 10.5%, a difference of 29.6%.
Receiving Food Stamps Correlation Summary
| Measurement | Iroquois | Mongolian |
| Minimum | 4.9% | 0.30% |
| Maximum | 100.0% | 23.7% |
| Range | 95.1% | 23.4% |
| Mean | 17.9% | 8.5% |
| Median | 13.0% | 8.5% |
| Interquartile 25% (IQ1) | 9.5% | 4.0% |
| Interquartile 75% (IQ3) | 18.4% | 12.2% |
| Interquartile Range (IQR) | 8.9% | 8.2% |
| Standard Deviation (Sample) | 19.6% | 5.3% |
| Standard Deviation (Population) | 19.4% | 5.3% |
Similar Demographics by Receiving Food Stamps
Demographics Similar to Iroquois by Receiving Food Stamps
In terms of receiving food stamps, the demographic groups most similar to Iroquois are Immigrants from Micronesia (13.5%, a difference of 0.30%), Choctaw (13.6%, a difference of 0.43%), French American Indian (13.5%, a difference of 0.53%), Immigrants from Panama (13.6%, a difference of 0.62%), and Immigrants from El Salvador (13.5%, a difference of 0.72%).
| Demographics | Rating | Rank | Receiving Food Stamps |
| Cherokee | 2.5 /100 | #233 | Tragic 13.2% |
| Comanche | 2.4 /100 | #234 | Tragic 13.3% |
| Immigrants | Zaire | 1.9 /100 | #235 | Tragic 13.4% |
| Crow | 1.6 /100 | #236 | Tragic 13.4% |
| Immigrants | El Salvador | 1.5 /100 | #237 | Tragic 13.5% |
| French American Indians | 1.4 /100 | #238 | Tragic 13.5% |
| Immigrants | Micronesia | 1.3 /100 | #239 | Tragic 13.5% |
| Iroquois | 1.2 /100 | #240 | Tragic 13.5% |
| Choctaw | 1.0 /100 | #241 | Tragic 13.6% |
| Immigrants | Panama | 1.0 /100 | #242 | Tragic 13.6% |
| Somalis | 0.9 /100 | #243 | Tragic 13.7% |
| Cajuns | 0.9 /100 | #244 | Tragic 13.7% |
| Immigrants | Somalia | 0.9 /100 | #245 | Tragic 13.7% |
| Cree | 0.8 /100 | #246 | Tragic 13.7% |
| Mexican American Indians | 0.7 /100 | #247 | Tragic 13.8% |
Demographics Similar to Mongolians by Receiving Food Stamps
In terms of receiving food stamps, the demographic groups most similar to Mongolians are Romanian (10.4%, a difference of 0.010%), Pakistani (10.4%, a difference of 0.11%), Icelander (10.5%, a difference of 0.38%), Immigrants from Pakistan (10.4%, a difference of 0.39%), and Carpatho Rusyn (10.4%, a difference of 0.44%).
| Demographics | Rating | Rank | Receiving Food Stamps |
| Immigrants | Malaysia | 96.5 /100 | #105 | Exceptional 10.4% |
| Immigrants | Italy | 96.4 /100 | #106 | Exceptional 10.4% |
| Koreans | 96.3 /100 | #107 | Exceptional 10.4% |
| Carpatho Rusyns | 96.2 /100 | #108 | Exceptional 10.4% |
| Immigrants | Pakistan | 96.2 /100 | #109 | Exceptional 10.4% |
| Pakistanis | 95.9 /100 | #110 | Exceptional 10.4% |
| Romanians | 95.8 /100 | #111 | Exceptional 10.4% |
| Mongolians | 95.8 /100 | #112 | Exceptional 10.5% |
| Icelanders | 95.4 /100 | #113 | Exceptional 10.5% |
| Scotch-Irish | 95.1 /100 | #114 | Exceptional 10.5% |
| Immigrants | Saudi Arabia | 94.9 /100 | #115 | Exceptional 10.5% |
| Canadians | 94.8 /100 | #116 | Exceptional 10.5% |
| Immigrants | Nepal | 94.6 /100 | #117 | Exceptional 10.6% |
| Assyrians/Chaldeans/Syriacs | 94.1 /100 | #118 | Exceptional 10.6% |
| Immigrants | Poland | 93.9 /100 | #119 | Exceptional 10.6% |