Irish vs Immigrants from Zaire Male Poverty
COMPARE
Irish
Immigrants from Zaire
Male Poverty
Male Poverty Comparison
Irish
Immigrants from Zaire
10.3%
MALE POVERTY
96.8/ 100
METRIC RATING
78th/ 347
METRIC RANK
13.8%
MALE POVERTY
0.0/ 100
METRIC RATING
290th/ 347
METRIC RANK
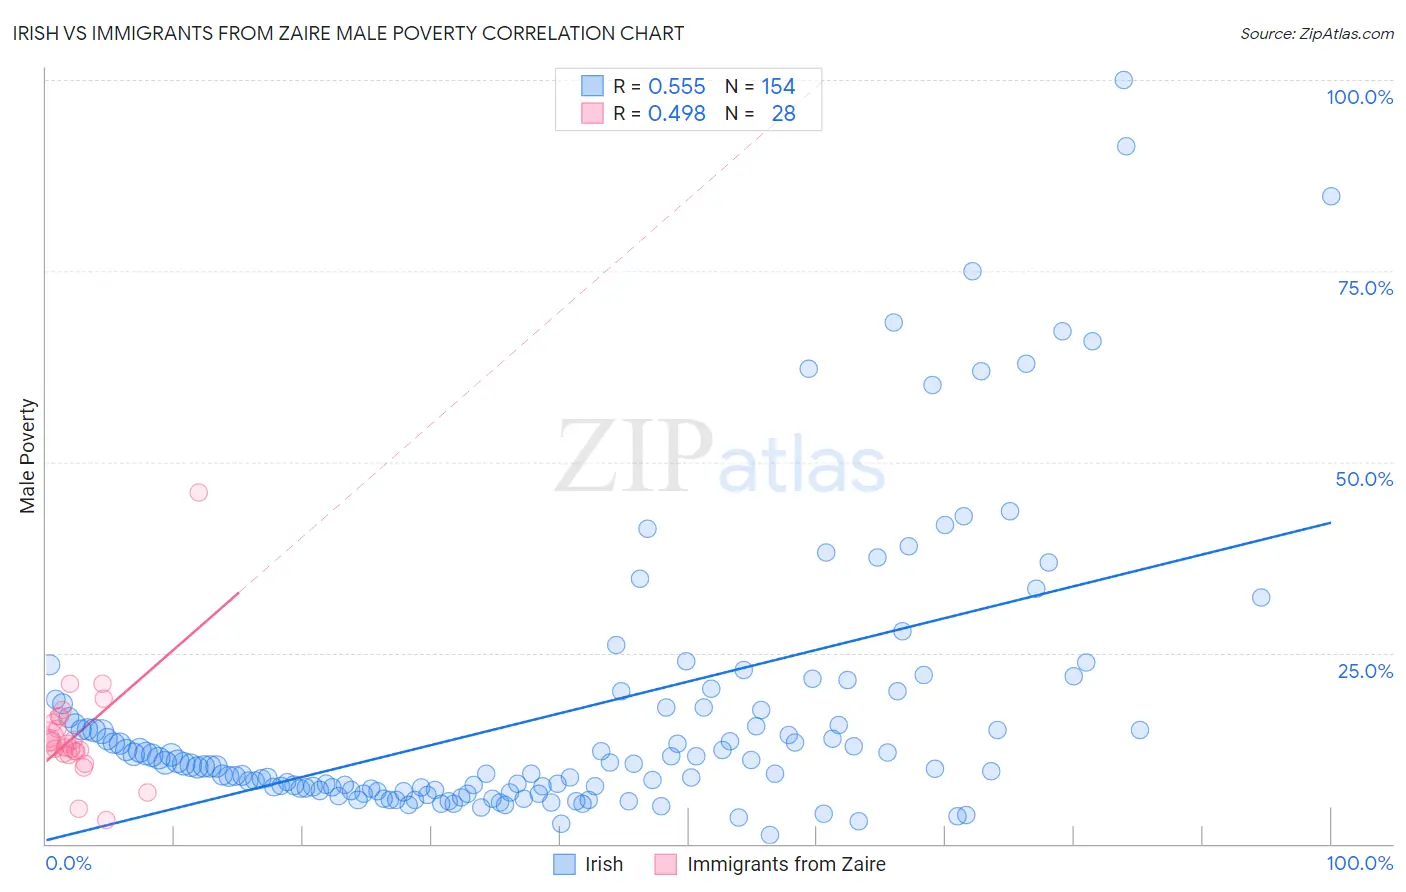
Irish vs Immigrants from Zaire Male Poverty Correlation Chart
The statistical analysis conducted on geographies consisting of 578,330,947 people shows a substantial positive correlation between the proportion of Irish and poverty level among males in the United States with a correlation coefficient (R) of 0.555 and weighted average of 10.3%. Similarly, the statistical analysis conducted on geographies consisting of 107,236,252 people shows a moderate positive correlation between the proportion of Immigrants from Zaire and poverty level among males in the United States with a correlation coefficient (R) of 0.498 and weighted average of 13.8%, a difference of 34.7%.
Male Poverty Correlation Summary
| Measurement | Irish | Immigrants from Zaire |
| Minimum | 1.2% | 3.1% |
| Maximum | 100.0% | 45.9% |
| Range | 98.8% | 42.8% |
| Mean | 17.0% | 14.3% |
| Median | 10.4% | 13.3% |
| Interquartile 25% (IQ1) | 7.0% | 11.9% |
| Interquartile 75% (IQ3) | 17.8% | 16.3% |
| Interquartile Range (IQR) | 10.8% | 4.4% |
| Standard Deviation (Sample) | 18.1% | 7.4% |
| Standard Deviation (Population) | 18.1% | 7.3% |
Similar Demographics by Male Poverty
Demographics Similar to Irish by Male Poverty
In terms of male poverty, the demographic groups most similar to Irish are Immigrants from Belgium (10.3%, a difference of 0.020%), Dutch (10.2%, a difference of 0.050%), Carpatho Rusyn (10.2%, a difference of 0.060%), Immigrants from Eastern Europe (10.2%, a difference of 0.070%), and Immigrants from Asia (10.2%, a difference of 0.14%).
| Demographics | Rating | Rank | Male Poverty |
| Europeans | 97.1 /100 | #71 | Exceptional 10.2% |
| Immigrants | Canada | 97.1 /100 | #72 | Exceptional 10.2% |
| Immigrants | Asia | 97.0 /100 | #73 | Exceptional 10.2% |
| Immigrants | Eastern Europe | 96.9 /100 | #74 | Exceptional 10.2% |
| Carpatho Rusyns | 96.9 /100 | #75 | Exceptional 10.2% |
| Dutch | 96.9 /100 | #76 | Exceptional 10.2% |
| Immigrants | Belgium | 96.8 /100 | #77 | Exceptional 10.3% |
| Irish | 96.8 /100 | #78 | Exceptional 10.3% |
| Immigrants | North America | 96.5 /100 | #79 | Exceptional 10.3% |
| English | 96.4 /100 | #80 | Exceptional 10.3% |
| Belgians | 95.9 /100 | #81 | Exceptional 10.3% |
| Egyptians | 95.9 /100 | #82 | Exceptional 10.3% |
| Immigrants | Sweden | 95.7 /100 | #83 | Exceptional 10.3% |
| Czechoslovakians | 95.6 /100 | #84 | Exceptional 10.3% |
| Immigrants | England | 95.5 /100 | #85 | Exceptional 10.4% |
Demographics Similar to Immigrants from Zaire by Male Poverty
In terms of male poverty, the demographic groups most similar to Immigrants from Zaire are Guatemalan (13.8%, a difference of 0.010%), Vietnamese (13.8%, a difference of 0.090%), Immigrants from St. Vincent and the Grenadines (13.8%, a difference of 0.18%), Indonesian (13.8%, a difference of 0.26%), and Immigrants from Belize (13.8%, a difference of 0.27%).
| Demographics | Rating | Rank | Male Poverty |
| Comanche | 0.0 /100 | #283 | Tragic 13.8% |
| Immigrants | Haiti | 0.0 /100 | #284 | Tragic 13.8% |
| West Indians | 0.0 /100 | #285 | Tragic 13.8% |
| Shoshone | 0.0 /100 | #286 | Tragic 13.8% |
| Immigrants | Barbados | 0.0 /100 | #287 | Tragic 13.8% |
| Immigrants | St. Vincent and the Grenadines | 0.0 /100 | #288 | Tragic 13.8% |
| Guatemalans | 0.0 /100 | #289 | Tragic 13.8% |
| Immigrants | Zaire | 0.0 /100 | #290 | Tragic 13.8% |
| Vietnamese | 0.0 /100 | #291 | Tragic 13.8% |
| Indonesians | 0.0 /100 | #292 | Tragic 13.8% |
| Immigrants | Belize | 0.0 /100 | #293 | Tragic 13.8% |
| Hispanics or Latinos | 0.0 /100 | #294 | Tragic 13.9% |
| Immigrants | Central America | 0.0 /100 | #295 | Tragic 13.9% |
| Cajuns | 0.0 /100 | #296 | Tragic 13.9% |
| Inupiat | 0.0 /100 | #297 | Tragic 14.0% |