Immigrants from Caribbean vs Immigrants from Zaire Male Poverty
COMPARE
Immigrants from Caribbean
Immigrants from Zaire
Male Poverty
Male Poverty Comparison
Immigrants from Caribbean
Immigrants from Zaire
14.0%
MALE POVERTY
0.0/ 100
METRIC RATING
302nd/ 347
METRIC RANK
13.8%
MALE POVERTY
0.0/ 100
METRIC RATING
290th/ 347
METRIC RANK
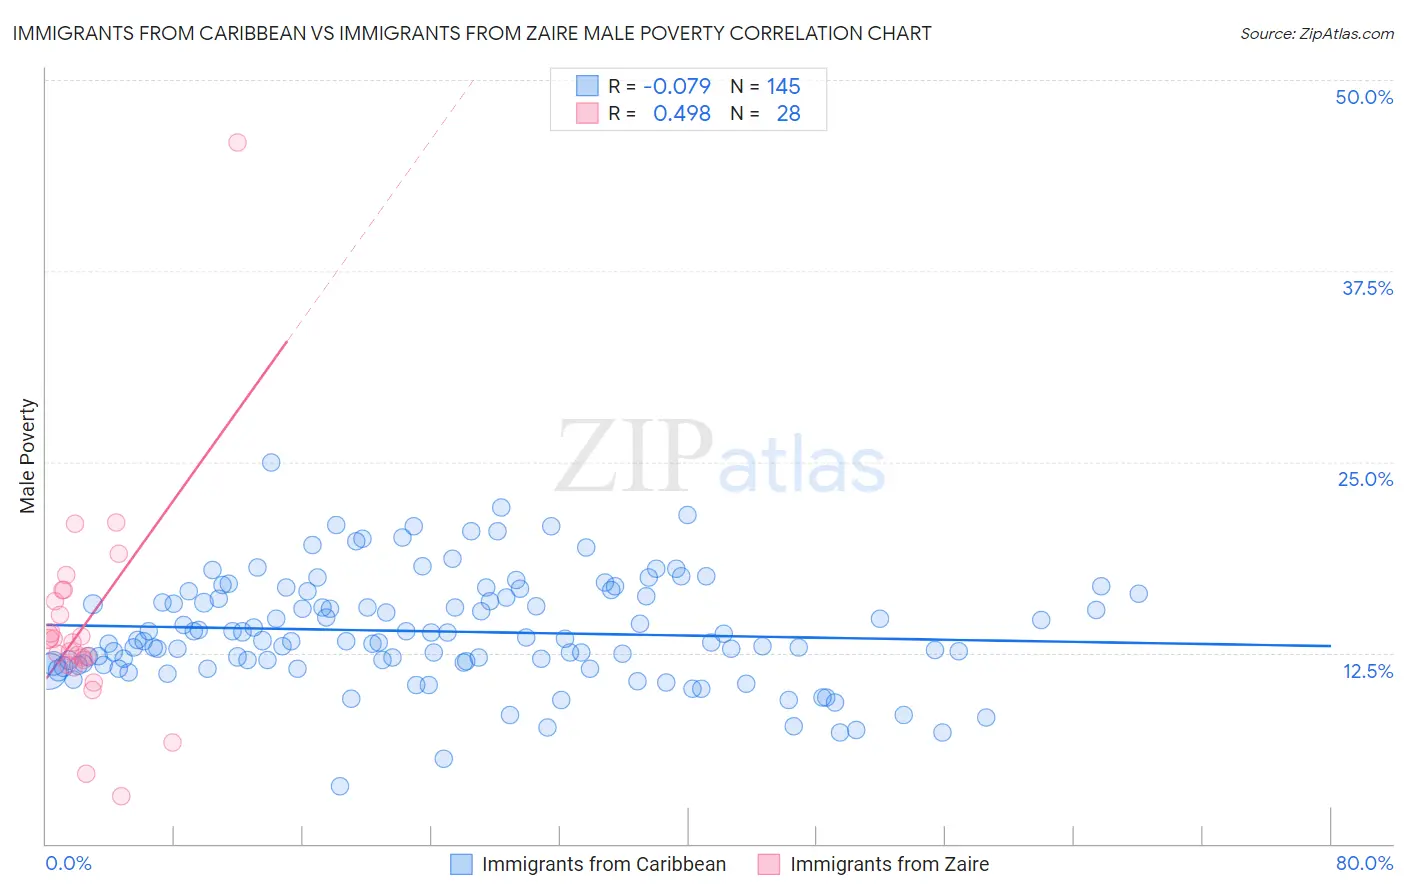
Immigrants from Caribbean vs Immigrants from Zaire Male Poverty Correlation Chart
The statistical analysis conducted on geographies consisting of 449,415,069 people shows a slight negative correlation between the proportion of Immigrants from Caribbean and poverty level among males in the United States with a correlation coefficient (R) of -0.079 and weighted average of 14.0%. Similarly, the statistical analysis conducted on geographies consisting of 107,236,252 people shows a moderate positive correlation between the proportion of Immigrants from Zaire and poverty level among males in the United States with a correlation coefficient (R) of 0.498 and weighted average of 13.8%, a difference of 1.7%.
Male Poverty Correlation Summary
| Measurement | Immigrants from Caribbean | Immigrants from Zaire |
| Minimum | 3.7% | 3.1% |
| Maximum | 25.0% | 45.9% |
| Range | 21.3% | 42.8% |
| Mean | 13.9% | 14.3% |
| Median | 13.3% | 13.3% |
| Interquartile 25% (IQ1) | 11.8% | 11.9% |
| Interquartile 75% (IQ3) | 16.3% | 16.3% |
| Interquartile Range (IQR) | 4.5% | 4.4% |
| Standard Deviation (Sample) | 3.5% | 7.4% |
| Standard Deviation (Population) | 3.5% | 7.3% |
Demographics Similar to Immigrants from Caribbean and Immigrants from Zaire by Male Poverty
In terms of male poverty, the demographic groups most similar to Immigrants from Caribbean are Bahamian (14.1%, a difference of 0.040%), Immigrants from Senegal (14.0%, a difference of 0.060%), Immigrants from Mexico (14.0%, a difference of 0.13%), Senegalese (14.1%, a difference of 0.14%), and Immigrants from Guatemala (14.0%, a difference of 0.24%). Similarly, the demographic groups most similar to Immigrants from Zaire are Guatemalan (13.8%, a difference of 0.010%), Vietnamese (13.8%, a difference of 0.090%), Immigrants from St. Vincent and the Grenadines (13.8%, a difference of 0.18%), Indonesian (13.8%, a difference of 0.26%), and Immigrants from Belize (13.8%, a difference of 0.27%).
| Demographics | Rating | Rank | Male Poverty |
| Shoshone | 0.0 /100 | #286 | Tragic 13.8% |
| Immigrants | Barbados | 0.0 /100 | #287 | Tragic 13.8% |
| Immigrants | St. Vincent and the Grenadines | 0.0 /100 | #288 | Tragic 13.8% |
| Guatemalans | 0.0 /100 | #289 | Tragic 13.8% |
| Immigrants | Zaire | 0.0 /100 | #290 | Tragic 13.8% |
| Vietnamese | 0.0 /100 | #291 | Tragic 13.8% |
| Indonesians | 0.0 /100 | #292 | Tragic 13.8% |
| Immigrants | Belize | 0.0 /100 | #293 | Tragic 13.8% |
| Hispanics or Latinos | 0.0 /100 | #294 | Tragic 13.9% |
| Immigrants | Central America | 0.0 /100 | #295 | Tragic 13.9% |
| Cajuns | 0.0 /100 | #296 | Tragic 13.9% |
| Inupiat | 0.0 /100 | #297 | Tragic 14.0% |
| Blackfeet | 0.0 /100 | #298 | Tragic 14.0% |
| Immigrants | Guatemala | 0.0 /100 | #299 | Tragic 14.0% |
| Immigrants | Mexico | 0.0 /100 | #300 | Tragic 14.0% |
| Immigrants | Senegal | 0.0 /100 | #301 | Tragic 14.0% |
| Immigrants | Caribbean | 0.0 /100 | #302 | Tragic 14.0% |
| Bahamians | 0.0 /100 | #303 | Tragic 14.1% |
| Senegalese | 0.0 /100 | #304 | Tragic 14.1% |
| Immigrants | Bangladesh | 0.0 /100 | #305 | Tragic 14.1% |
| Creek | 0.0 /100 | #306 | Tragic 14.1% |