Irish vs Immigrants from Uzbekistan Female Poverty
COMPARE
Irish
Immigrants from Uzbekistan
Female Poverty
Female Poverty Comparison
Irish
Immigrants from Uzbekistan
12.4%
FEMALE POVERTY
96.5/ 100
METRIC RATING
85th/ 347
METRIC RANK
14.4%
FEMALE POVERTY
4.4/ 100
METRIC RATING
218th/ 347
METRIC RANK
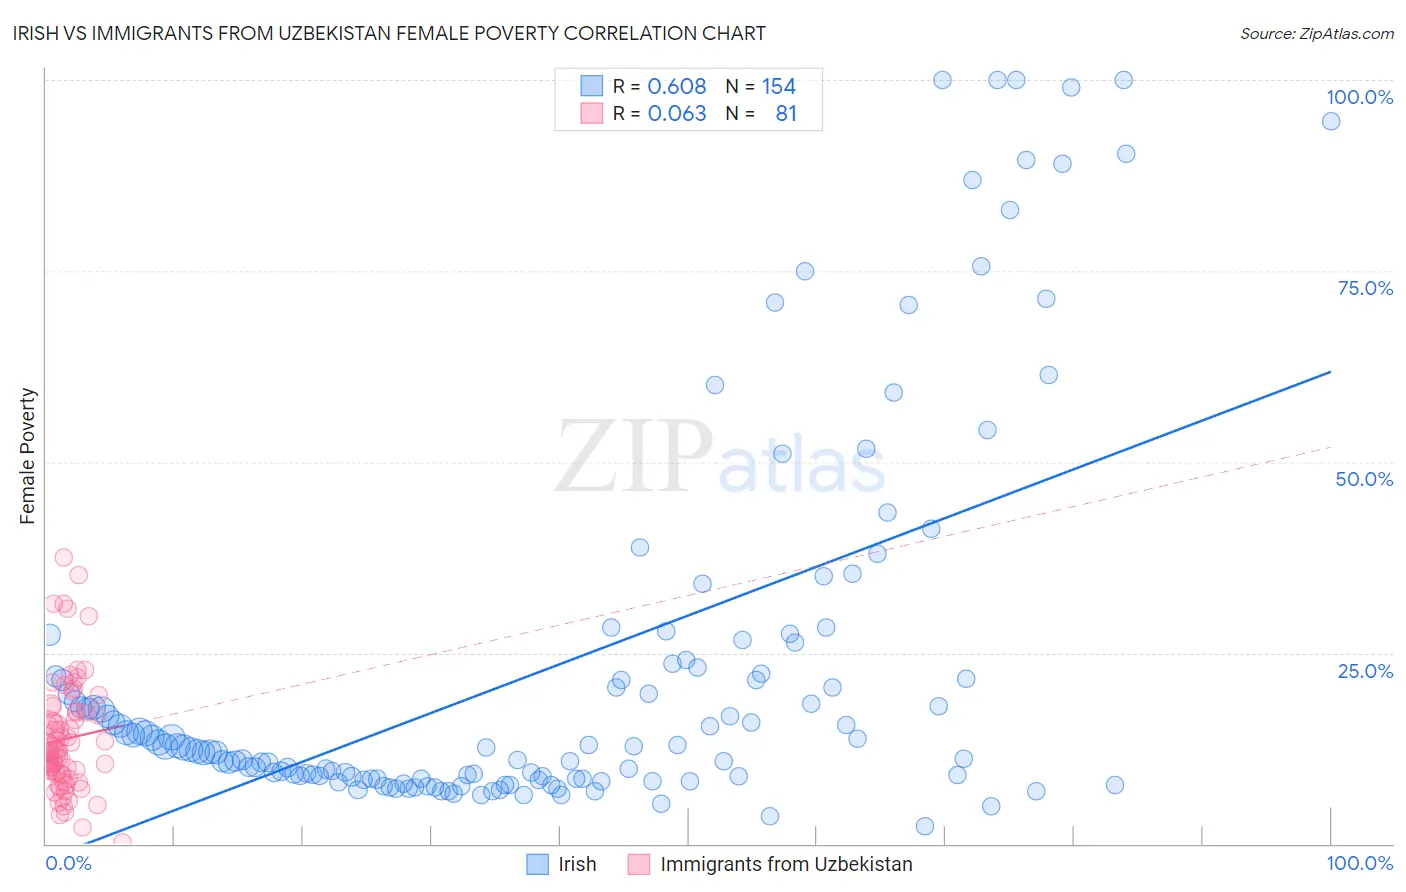
Irish vs Immigrants from Uzbekistan Female Poverty Correlation Chart
The statistical analysis conducted on geographies consisting of 578,836,064 people shows a significant positive correlation between the proportion of Irish and poverty level among females in the United States with a correlation coefficient (R) of 0.608 and weighted average of 12.4%. Similarly, the statistical analysis conducted on geographies consisting of 118,710,626 people shows a slight positive correlation between the proportion of Immigrants from Uzbekistan and poverty level among females in the United States with a correlation coefficient (R) of 0.063 and weighted average of 14.4%, a difference of 16.8%.
Female Poverty Correlation Summary
| Measurement | Irish | Immigrants from Uzbekistan |
| Minimum | 2.3% | 0.21% |
| Maximum | 100.0% | 37.5% |
| Range | 97.7% | 37.3% |
| Mean | 23.1% | 13.7% |
| Median | 12.6% | 12.3% |
| Interquartile 25% (IQ1) | 8.5% | 9.1% |
| Interquartile 75% (IQ3) | 23.0% | 17.2% |
| Interquartile Range (IQR) | 14.6% | 8.0% |
| Standard Deviation (Sample) | 24.9% | 7.4% |
| Standard Deviation (Population) | 24.8% | 7.3% |
Similar Demographics by Female Poverty
Demographics Similar to Irish by Female Poverty
In terms of female poverty, the demographic groups most similar to Irish are Dutch (12.4%, a difference of 0.030%), Northern European (12.4%, a difference of 0.050%), Okinawan (12.4%, a difference of 0.050%), Finnish (12.4%, a difference of 0.090%), and Immigrants from England (12.3%, a difference of 0.29%).
| Demographics | Rating | Rank | Female Poverty |
| Egyptians | 97.2 /100 | #78 | Exceptional 12.3% |
| Immigrants | North America | 97.1 /100 | #79 | Exceptional 12.3% |
| Slovaks | 97.1 /100 | #80 | Exceptional 12.3% |
| Immigrants | Sweden | 97.1 /100 | #81 | Exceptional 12.3% |
| Jordanians | 97.1 /100 | #82 | Exceptional 12.3% |
| Immigrants | England | 96.9 /100 | #83 | Exceptional 12.3% |
| Northern Europeans | 96.6 /100 | #84 | Exceptional 12.4% |
| Irish | 96.5 /100 | #85 | Exceptional 12.4% |
| Dutch | 96.5 /100 | #86 | Exceptional 12.4% |
| Okinawans | 96.4 /100 | #87 | Exceptional 12.4% |
| Finns | 96.4 /100 | #88 | Exceptional 12.4% |
| English | 96.1 /100 | #89 | Exceptional 12.4% |
| Immigrants | Denmark | 95.8 /100 | #90 | Exceptional 12.4% |
| Belgians | 95.8 /100 | #91 | Exceptional 12.4% |
| Czechoslovakians | 95.7 /100 | #92 | Exceptional 12.4% |
Demographics Similar to Immigrants from Uzbekistan by Female Poverty
In terms of female poverty, the demographic groups most similar to Immigrants from Uzbekistan are Immigrants (14.4%, a difference of 0.050%), Immigrants from Thailand (14.4%, a difference of 0.080%), Japanese (14.5%, a difference of 0.14%), Immigrants from Panama (14.4%, a difference of 0.17%), and Alsatian (14.5%, a difference of 0.18%).
| Demographics | Rating | Rank | Female Poverty |
| Moroccans | 7.2 /100 | #211 | Tragic 14.3% |
| Bermudans | 5.5 /100 | #212 | Tragic 14.4% |
| Alaskan Athabascans | 5.3 /100 | #213 | Tragic 14.4% |
| Marshallese | 5.0 /100 | #214 | Tragic 14.4% |
| Immigrants | Panama | 4.7 /100 | #215 | Tragic 14.4% |
| Immigrants | Thailand | 4.5 /100 | #216 | Tragic 14.4% |
| Immigrants | Immigrants | 4.5 /100 | #217 | Tragic 14.4% |
| Immigrants | Uzbekistan | 4.4 /100 | #218 | Tragic 14.4% |
| Japanese | 4.1 /100 | #219 | Tragic 14.5% |
| Alsatians | 4.0 /100 | #220 | Tragic 14.5% |
| Immigrants | Cambodia | 3.7 /100 | #221 | Tragic 14.5% |
| Immigrants | Nonimmigrants | 3.7 /100 | #222 | Tragic 14.5% |
| Immigrants | Africa | 3.3 /100 | #223 | Tragic 14.5% |
| Americans | 2.8 /100 | #224 | Tragic 14.6% |
| Immigrants | Micronesia | 2.8 /100 | #225 | Tragic 14.6% |