Iranian vs Immigrants from Sweden Family Poverty
COMPARE
Iranian
Immigrants from Sweden
Family Poverty
Family Poverty Comparison
Iranians
Immigrants from Sweden
7.1%
FAMILY POVERTY
99.8/ 100
METRIC RATING
14th/ 347
METRIC RANK
7.7%
FAMILY POVERTY
98.8/ 100
METRIC RATING
54th/ 347
METRIC RANK
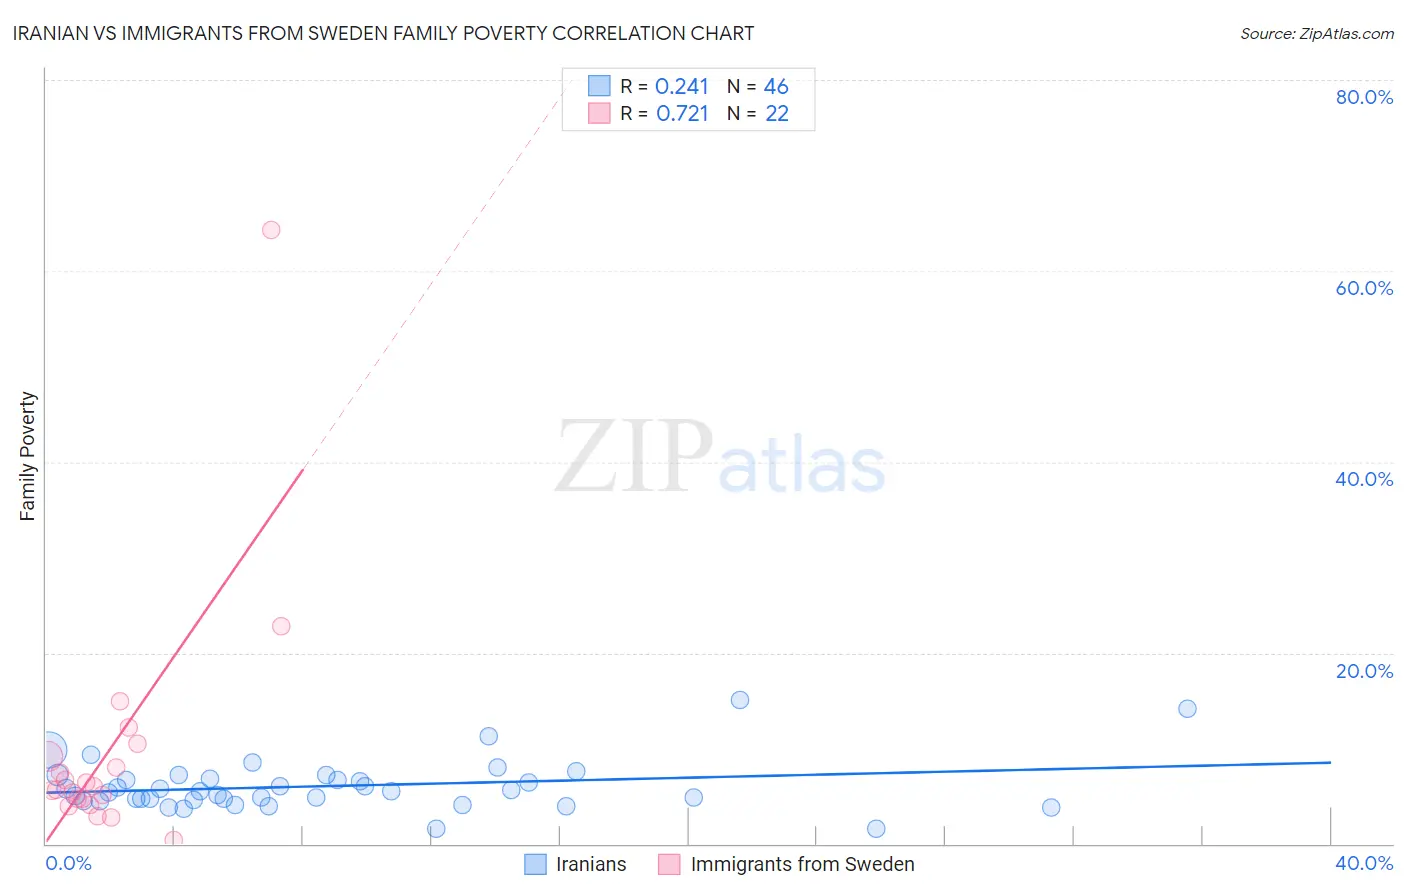
Iranian vs Immigrants from Sweden Family Poverty Correlation Chart
The statistical analysis conducted on geographies consisting of 316,120,313 people shows a weak positive correlation between the proportion of Iranians and poverty level among families in the United States with a correlation coefficient (R) of 0.241 and weighted average of 7.1%. Similarly, the statistical analysis conducted on geographies consisting of 164,497,176 people shows a strong positive correlation between the proportion of Immigrants from Sweden and poverty level among families in the United States with a correlation coefficient (R) of 0.721 and weighted average of 7.7%, a difference of 8.4%.
Family Poverty Correlation Summary
| Measurement | Iranian | Immigrants from Sweden |
| Minimum | 1.6% | 0.43% |
| Maximum | 15.0% | 64.3% |
| Range | 13.4% | 63.9% |
| Mean | 6.0% | 9.7% |
| Median | 5.5% | 5.8% |
| Interquartile 25% (IQ1) | 4.5% | 4.8% |
| Interquartile 75% (IQ3) | 6.8% | 9.1% |
| Interquartile Range (IQR) | 2.3% | 4.4% |
| Standard Deviation (Sample) | 2.6% | 13.1% |
| Standard Deviation (Population) | 2.6% | 12.8% |
Similar Demographics by Family Poverty
Demographics Similar to Iranians by Family Poverty
In terms of family poverty, the demographic groups most similar to Iranians are Swedish (7.1%, a difference of 0.010%), Maltese (7.1%, a difference of 0.060%), Immigrants from Singapore (7.1%, a difference of 0.34%), Bulgarian (7.1%, a difference of 0.36%), and Latvian (7.1%, a difference of 0.61%).
| Demographics | Rating | Rank | Family Poverty |
| Immigrants | Ireland | 99.9 /100 | #7 | Exceptional 7.0% |
| Bhutanese | 99.9 /100 | #8 | Exceptional 7.0% |
| Latvians | 99.9 /100 | #9 | Exceptional 7.1% |
| Bulgarians | 99.8 /100 | #10 | Exceptional 7.1% |
| Immigrants | Singapore | 99.8 /100 | #11 | Exceptional 7.1% |
| Maltese | 99.8 /100 | #12 | Exceptional 7.1% |
| Swedes | 99.8 /100 | #13 | Exceptional 7.1% |
| Iranians | 99.8 /100 | #14 | Exceptional 7.1% |
| Lithuanians | 99.8 /100 | #15 | Exceptional 7.2% |
| Immigrants | South Central Asia | 99.8 /100 | #16 | Exceptional 7.2% |
| Luxembourgers | 99.8 /100 | #17 | Exceptional 7.2% |
| Immigrants | Lithuania | 99.8 /100 | #18 | Exceptional 7.2% |
| Eastern Europeans | 99.7 /100 | #19 | Exceptional 7.2% |
| Immigrants | Hong Kong | 99.7 /100 | #20 | Exceptional 7.3% |
| Immigrants | Iran | 99.7 /100 | #21 | Exceptional 7.3% |
Demographics Similar to Immigrants from Sweden by Family Poverty
In terms of family poverty, the demographic groups most similar to Immigrants from Sweden are Swiss (7.7%, a difference of 0.010%), Immigrants from Eastern Asia (7.7%, a difference of 0.030%), Indian (Asian) (7.7%, a difference of 0.070%), Immigrants from Serbia (7.7%, a difference of 0.070%), and Asian (7.7%, a difference of 0.16%).
| Demographics | Rating | Rank | Family Poverty |
| Immigrants | Czechoslovakia | 98.9 /100 | #47 | Exceptional 7.7% |
| Immigrants | Sri Lanka | 98.9 /100 | #48 | Exceptional 7.7% |
| Immigrants | Bolivia | 98.9 /100 | #49 | Exceptional 7.7% |
| Immigrants | North Macedonia | 98.9 /100 | #50 | Exceptional 7.7% |
| Immigrants | Moldova | 98.8 /100 | #51 | Exceptional 7.7% |
| Indians (Asian) | 98.8 /100 | #52 | Exceptional 7.7% |
| Swiss | 98.8 /100 | #53 | Exceptional 7.7% |
| Immigrants | Sweden | 98.8 /100 | #54 | Exceptional 7.7% |
| Immigrants | Eastern Asia | 98.7 /100 | #55 | Exceptional 7.7% |
| Immigrants | Serbia | 98.7 /100 | #56 | Exceptional 7.7% |
| Asians | 98.7 /100 | #57 | Exceptional 7.7% |
| Finns | 98.7 /100 | #58 | Exceptional 7.7% |
| Europeans | 98.7 /100 | #59 | Exceptional 7.7% |
| Immigrants | Greece | 98.7 /100 | #60 | Exceptional 7.7% |
| Immigrants | Netherlands | 98.6 /100 | #61 | Exceptional 7.7% |