Iranian vs Hawaiian Family Poverty
COMPARE
Iranian
Hawaiian
Family Poverty
Family Poverty Comparison
Iranians
Hawaiians
7.1%
FAMILY POVERTY
99.8/ 100
METRIC RATING
14th/ 347
METRIC RANK
9.0%
FAMILY POVERTY
47.2/ 100
METRIC RATING
177th/ 347
METRIC RANK
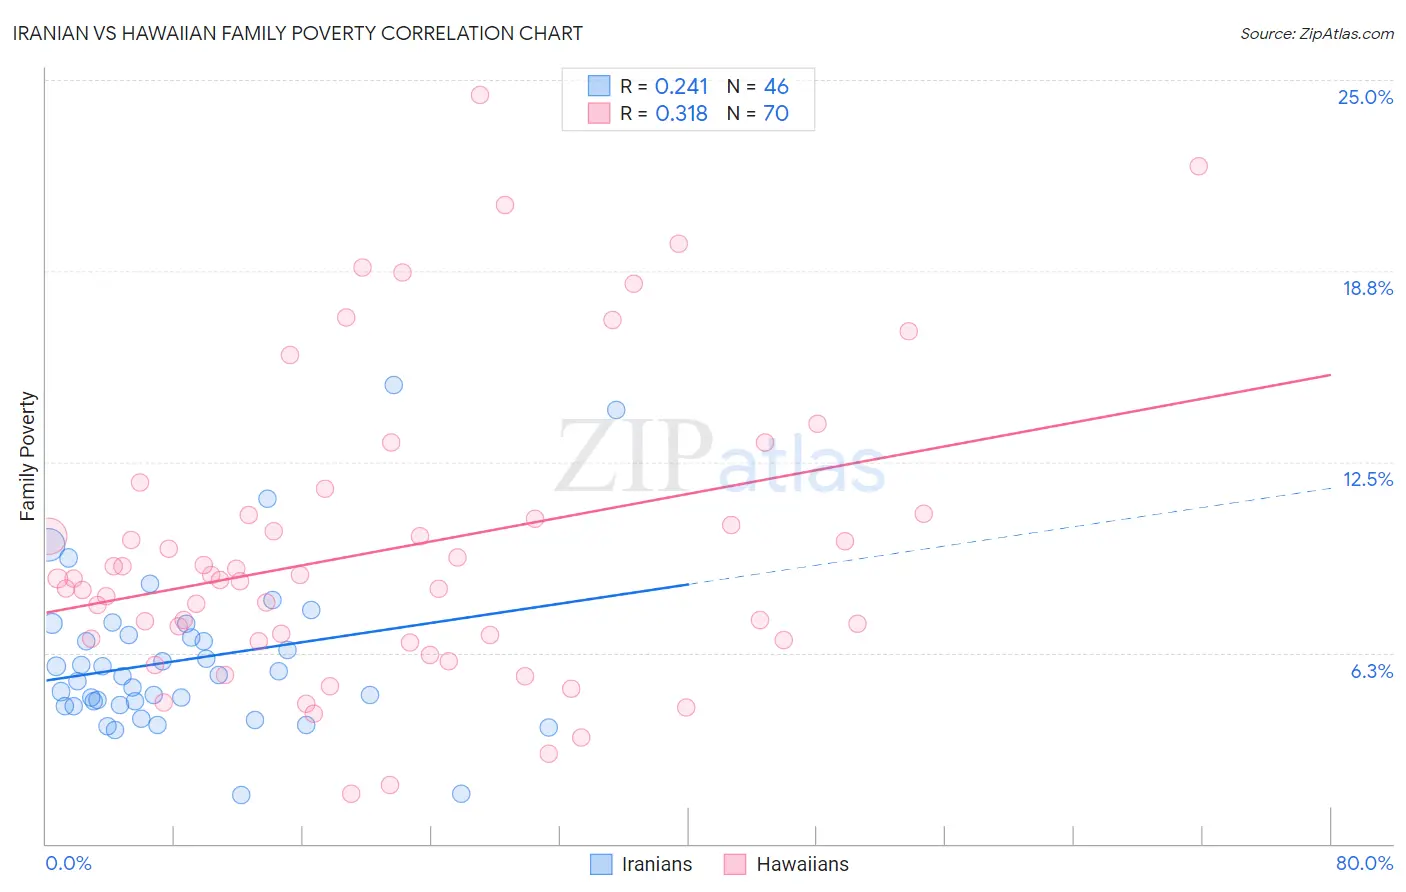
Iranian vs Hawaiian Family Poverty Correlation Chart
The statistical analysis conducted on geographies consisting of 316,120,313 people shows a weak positive correlation between the proportion of Iranians and poverty level among families in the United States with a correlation coefficient (R) of 0.241 and weighted average of 7.1%. Similarly, the statistical analysis conducted on geographies consisting of 327,007,125 people shows a mild positive correlation between the proportion of Hawaiians and poverty level among families in the United States with a correlation coefficient (R) of 0.318 and weighted average of 9.0%, a difference of 26.9%.
Family Poverty Correlation Summary
| Measurement | Iranian | Hawaiian |
| Minimum | 1.6% | 1.6% |
| Maximum | 15.0% | 24.5% |
| Range | 13.4% | 22.9% |
| Mean | 6.0% | 9.6% |
| Median | 5.5% | 8.7% |
| Interquartile 25% (IQ1) | 4.5% | 6.7% |
| Interquartile 75% (IQ3) | 6.8% | 10.8% |
| Interquartile Range (IQR) | 2.3% | 4.1% |
| Standard Deviation (Sample) | 2.6% | 4.9% |
| Standard Deviation (Population) | 2.6% | 4.8% |
Similar Demographics by Family Poverty
Demographics Similar to Iranians by Family Poverty
In terms of family poverty, the demographic groups most similar to Iranians are Swedish (7.1%, a difference of 0.010%), Maltese (7.1%, a difference of 0.060%), Immigrants from Singapore (7.1%, a difference of 0.34%), Bulgarian (7.1%, a difference of 0.36%), and Latvian (7.1%, a difference of 0.61%).
| Demographics | Rating | Rank | Family Poverty |
| Immigrants | Ireland | 99.9 /100 | #7 | Exceptional 7.0% |
| Bhutanese | 99.9 /100 | #8 | Exceptional 7.0% |
| Latvians | 99.9 /100 | #9 | Exceptional 7.1% |
| Bulgarians | 99.8 /100 | #10 | Exceptional 7.1% |
| Immigrants | Singapore | 99.8 /100 | #11 | Exceptional 7.1% |
| Maltese | 99.8 /100 | #12 | Exceptional 7.1% |
| Swedes | 99.8 /100 | #13 | Exceptional 7.1% |
| Iranians | 99.8 /100 | #14 | Exceptional 7.1% |
| Lithuanians | 99.8 /100 | #15 | Exceptional 7.2% |
| Immigrants | South Central Asia | 99.8 /100 | #16 | Exceptional 7.2% |
| Luxembourgers | 99.8 /100 | #17 | Exceptional 7.2% |
| Immigrants | Lithuania | 99.8 /100 | #18 | Exceptional 7.2% |
| Eastern Europeans | 99.7 /100 | #19 | Exceptional 7.2% |
| Immigrants | Hong Kong | 99.7 /100 | #20 | Exceptional 7.3% |
| Immigrants | Iran | 99.7 /100 | #21 | Exceptional 7.3% |
Demographics Similar to Hawaiians by Family Poverty
In terms of family poverty, the demographic groups most similar to Hawaiians are Immigrants from Cameroon (9.0%, a difference of 0.010%), Immigrants from Syria (9.0%, a difference of 0.030%), Costa Rican (9.0%, a difference of 0.27%), Immigrants from Albania (9.0%, a difference of 0.36%), and Immigrants from Iraq (9.1%, a difference of 0.38%).
| Demographics | Rating | Rank | Family Poverty |
| Kenyans | 58.2 /100 | #170 | Average 8.9% |
| Lebanese | 57.6 /100 | #171 | Average 8.9% |
| Immigrants | Peru | 57.5 /100 | #172 | Average 8.9% |
| Immigrants | Fiji | 56.4 /100 | #173 | Average 8.9% |
| Immigrants | Albania | 50.0 /100 | #174 | Average 9.0% |
| Costa Ricans | 49.3 /100 | #175 | Average 9.0% |
| Immigrants | Syria | 47.5 /100 | #176 | Average 9.0% |
| Hawaiians | 47.2 /100 | #177 | Average 9.0% |
| Immigrants | Cameroon | 47.1 /100 | #178 | Average 9.0% |
| Immigrants | Iraq | 44.4 /100 | #179 | Average 9.1% |
| Immigrants | Uganda | 43.4 /100 | #180 | Average 9.1% |
| Hmong | 40.2 /100 | #181 | Average 9.1% |
| Immigrants | Morocco | 40.2 /100 | #182 | Average 9.1% |
| Uruguayans | 39.2 /100 | #183 | Fair 9.1% |
| South American Indians | 38.7 /100 | #184 | Fair 9.1% |