Inupiat vs Swedish Child Poverty Under the Age of 5
COMPARE
Inupiat
Swedish
Child Poverty Under the Age of 5
Child Poverty Under the Age of 5 Comparison
Inupiat
Swedes
22.0%
CHILD POVERTY UNDER THE AGE OF 5
0.0/ 100
METRIC RATING
303rd/ 347
METRIC RANK
15.0%
CHILD POVERTY UNDER THE AGE OF 5
99.4/ 100
METRIC RATING
58th/ 347
METRIC RANK
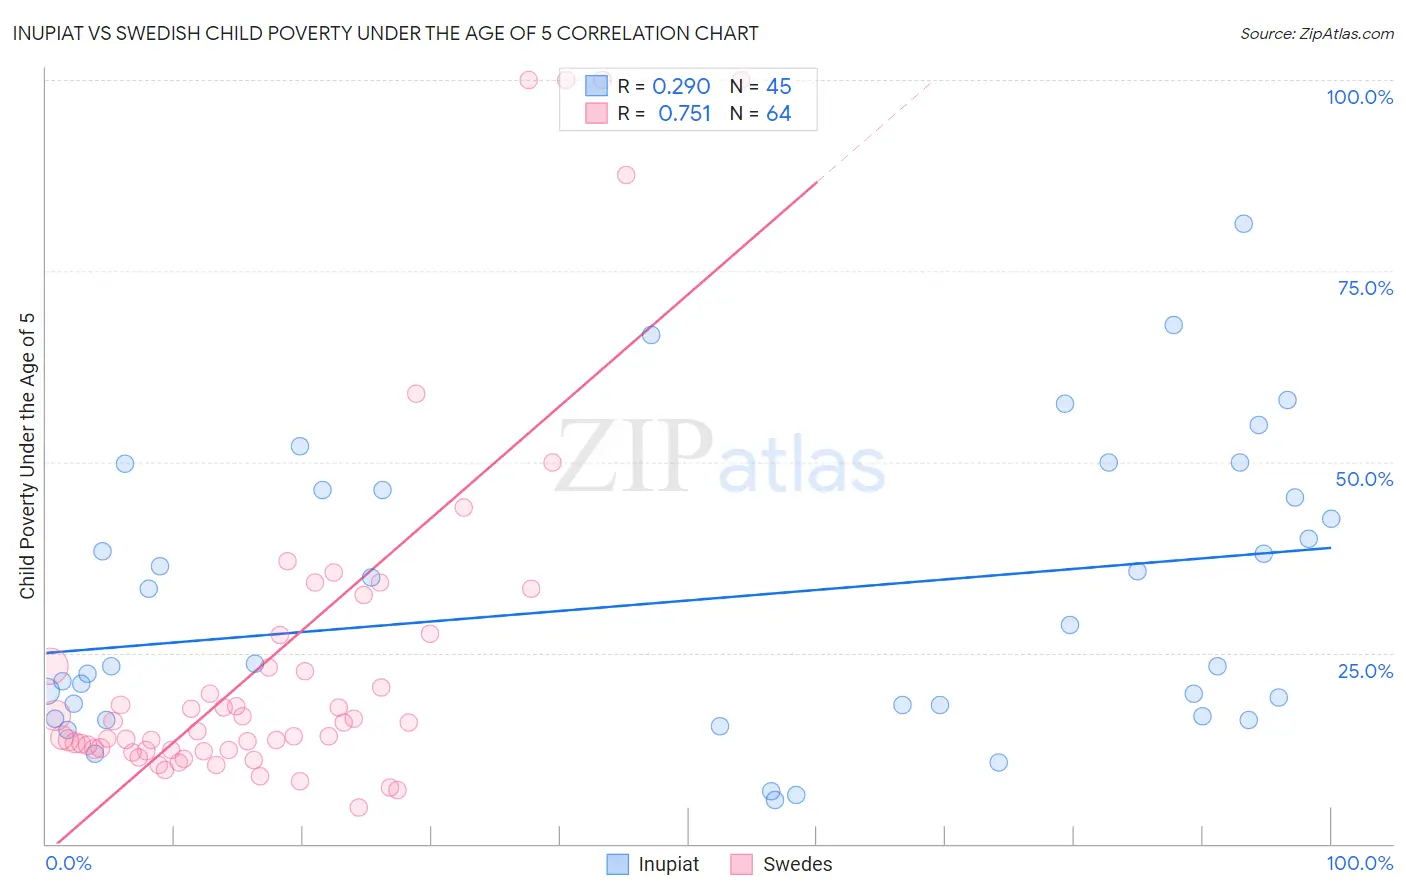
Inupiat vs Swedish Child Poverty Under the Age of 5 Correlation Chart
The statistical analysis conducted on geographies consisting of 95,492,262 people shows a weak positive correlation between the proportion of Inupiat and poverty level among children under the age of 5 in the United States with a correlation coefficient (R) of 0.290 and weighted average of 22.0%. Similarly, the statistical analysis conducted on geographies consisting of 502,877,472 people shows a strong positive correlation between the proportion of Swedes and poverty level among children under the age of 5 in the United States with a correlation coefficient (R) of 0.751 and weighted average of 15.0%, a difference of 47.3%.
Child Poverty Under the Age of 5 Correlation Summary
| Measurement | Inupiat | Swedish |
| Minimum | 5.8% | 4.8% |
| Maximum | 81.2% | 100.0% |
| Range | 75.5% | 95.2% |
| Mean | 32.0% | 24.6% |
| Median | 23.5% | 15.2% |
| Interquartile 25% (IQ1) | 17.4% | 12.3% |
| Interquartile 75% (IQ3) | 46.3% | 25.3% |
| Interquartile Range (IQR) | 28.8% | 13.0% |
| Standard Deviation (Sample) | 18.5% | 23.8% |
| Standard Deviation (Population) | 18.3% | 23.6% |
Similar Demographics by Child Poverty Under the Age of 5
Demographics Similar to Inupiat by Child Poverty Under the Age of 5
In terms of child poverty under the age of 5, the demographic groups most similar to Inupiat are Iroquois (22.0%, a difference of 0.090%), Immigrants from Guatemala (22.0%, a difference of 0.11%), Immigrants from Central America (22.0%, a difference of 0.25%), Alaskan Athabascan (21.8%, a difference of 0.91%), and Chickasaw (21.8%, a difference of 0.92%).
| Demographics | Rating | Rank | Child Poverty Under the Age of 5 |
| Yaqui | 0.0 /100 | #296 | Tragic 21.7% |
| Hispanics or Latinos | 0.0 /100 | #297 | Tragic 21.7% |
| Blackfeet | 0.0 /100 | #298 | Tragic 21.8% |
| Chickasaw | 0.0 /100 | #299 | Tragic 21.8% |
| Alaskan Athabascans | 0.0 /100 | #300 | Tragic 21.8% |
| Immigrants | Central America | 0.0 /100 | #301 | Tragic 22.0% |
| Iroquois | 0.0 /100 | #302 | Tragic 22.0% |
| Inupiat | 0.0 /100 | #303 | Tragic 22.0% |
| Immigrants | Guatemala | 0.0 /100 | #304 | Tragic 22.0% |
| Immigrants | Mexico | 0.0 /100 | #305 | Tragic 22.2% |
| Indonesians | 0.0 /100 | #306 | Tragic 22.3% |
| Immigrants | Bahamas | 0.0 /100 | #307 | Tragic 22.7% |
| Immigrants | Dominica | 0.0 /100 | #308 | Tragic 22.7% |
| Houma | 0.0 /100 | #309 | Tragic 22.7% |
| Africans | 0.0 /100 | #310 | Tragic 22.8% |
Demographics Similar to Swedes by Child Poverty Under the Age of 5
In terms of child poverty under the age of 5, the demographic groups most similar to Swedes are Egyptian (14.9%, a difference of 0.050%), Immigrants from Pakistan (14.9%, a difference of 0.13%), Paraguayan (15.0%, a difference of 0.15%), Danish (14.9%, a difference of 0.20%), and Immigrants from Russia (15.0%, a difference of 0.24%).
| Demographics | Rating | Rank | Child Poverty Under the Age of 5 |
| Estonians | 99.6 /100 | #51 | Exceptional 14.8% |
| Immigrants | Serbia | 99.5 /100 | #52 | Exceptional 14.9% |
| Luxembourgers | 99.4 /100 | #53 | Exceptional 14.9% |
| Immigrants | Israel | 99.4 /100 | #54 | Exceptional 14.9% |
| Danes | 99.4 /100 | #55 | Exceptional 14.9% |
| Immigrants | Pakistan | 99.4 /100 | #56 | Exceptional 14.9% |
| Egyptians | 99.4 /100 | #57 | Exceptional 14.9% |
| Swedes | 99.4 /100 | #58 | Exceptional 15.0% |
| Paraguayans | 99.4 /100 | #59 | Exceptional 15.0% |
| Immigrants | Russia | 99.3 /100 | #60 | Exceptional 15.0% |
| Immigrants | Poland | 99.1 /100 | #61 | Exceptional 15.1% |
| Immigrants | Eastern Europe | 99.1 /100 | #62 | Exceptional 15.1% |
| Immigrants | Europe | 99.1 /100 | #63 | Exceptional 15.1% |
| Immigrants | Romania | 99.1 /100 | #64 | Exceptional 15.2% |
| Immigrants | Fiji | 99.0 /100 | #65 | Exceptional 15.2% |