Immigrants from Zimbabwe vs Immigrants from South Central Asia Female Poverty Among 25-34 Year Olds
COMPARE
Immigrants from Zimbabwe
Immigrants from South Central Asia
Female Poverty Among 25-34 Year Olds
Female Poverty Among 25-34 Year Olds Comparison
Immigrants from Zimbabwe
Immigrants from South Central Asia
12.6%
FEMALE POVERTY AMONG 25-34 YEAR OLDS
96.7/ 100
METRIC RATING
96th/ 347
METRIC RANK
10.8%
FEMALE POVERTY AMONG 25-34 YEAR OLDS
100.0/ 100
METRIC RATING
6th/ 347
METRIC RANK
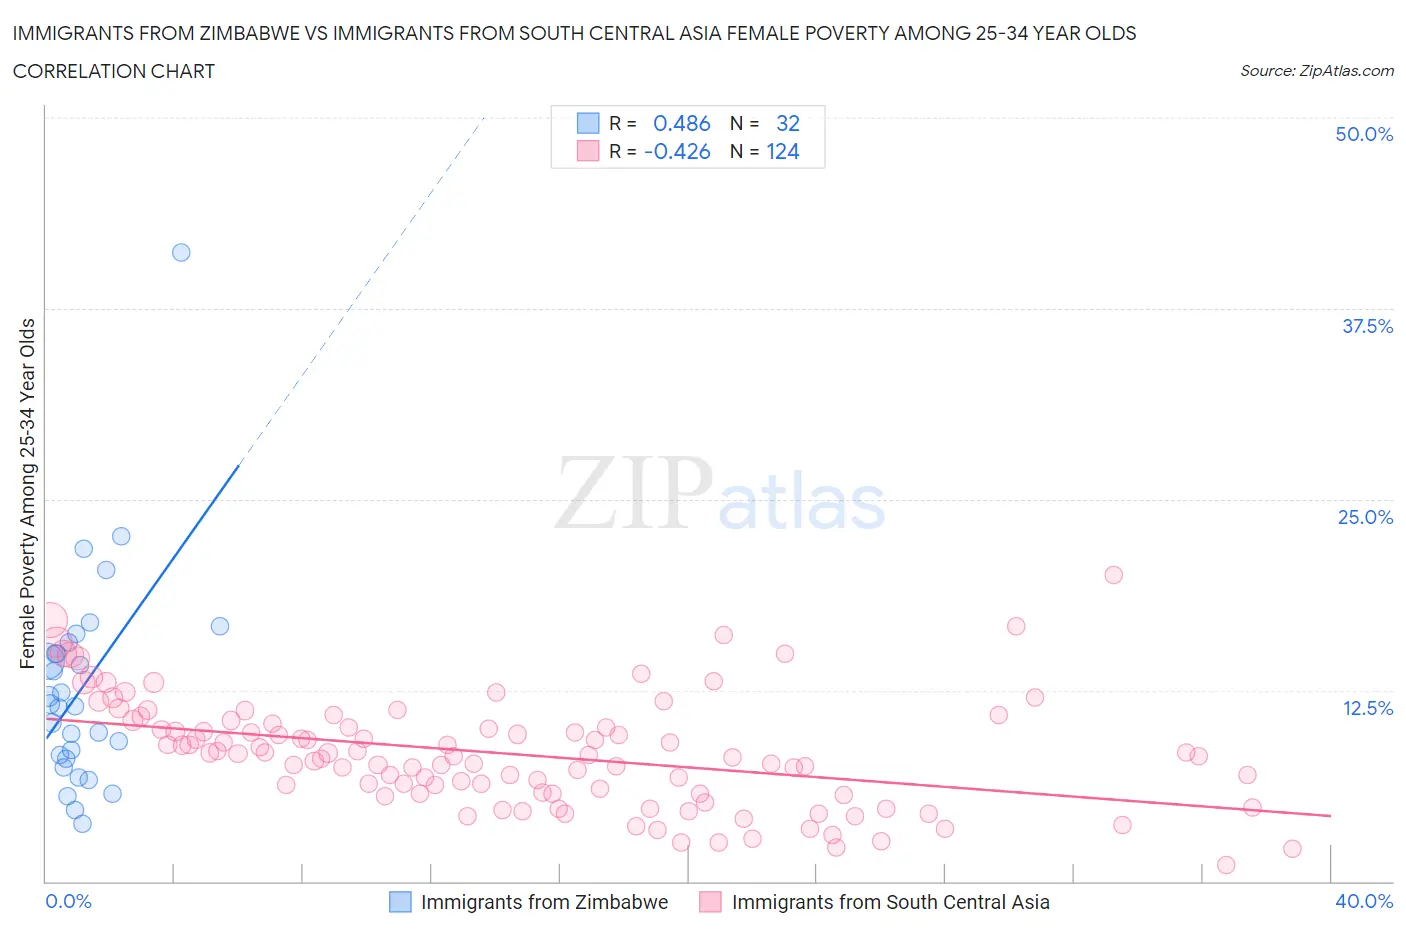
Immigrants from Zimbabwe vs Immigrants from South Central Asia Female Poverty Among 25-34 Year Olds Correlation Chart
The statistical analysis conducted on geographies consisting of 117,339,985 people shows a moderate positive correlation between the proportion of Immigrants from Zimbabwe and poverty level among females between the ages 25 and 34 in the United States with a correlation coefficient (R) of 0.486 and weighted average of 12.6%. Similarly, the statistical analysis conducted on geographies consisting of 462,497,138 people shows a moderate negative correlation between the proportion of Immigrants from South Central Asia and poverty level among females between the ages 25 and 34 in the United States with a correlation coefficient (R) of -0.426 and weighted average of 10.8%, a difference of 17.0%.
Female Poverty Among 25-34 Year Olds Correlation Summary
| Measurement | Immigrants from Zimbabwe | Immigrants from South Central Asia |
| Minimum | 3.8% | 1.0% |
| Maximum | 41.1% | 20.1% |
| Range | 37.4% | 19.0% |
| Mean | 12.7% | 8.3% |
| Median | 11.5% | 8.2% |
| Interquartile 25% (IQ1) | 8.1% | 5.8% |
| Interquartile 75% (IQ3) | 15.3% | 10.2% |
| Interquartile Range (IQR) | 7.2% | 4.4% |
| Standard Deviation (Sample) | 7.1% | 3.6% |
| Standard Deviation (Population) | 7.0% | 3.6% |
Similar Demographics by Female Poverty Among 25-34 Year Olds
Demographics Similar to Immigrants from Zimbabwe by Female Poverty Among 25-34 Year Olds
In terms of female poverty among 25-34 year olds, the demographic groups most similar to Immigrants from Zimbabwe are Ukrainian (12.6%, a difference of 0.010%), Immigrants from France (12.6%, a difference of 0.050%), Palestinian (12.6%, a difference of 0.10%), Immigrants from Northern Africa (12.6%, a difference of 0.12%), and Immigrants from Ethiopia (12.6%, a difference of 0.12%).
| Demographics | Rating | Rank | Female Poverty Among 25-34 Year Olds |
| Italians | 97.2 /100 | #89 | Exceptional 12.5% |
| Immigrants | Albania | 97.1 /100 | #90 | Exceptional 12.5% |
| Norwegians | 96.9 /100 | #91 | Exceptional 12.6% |
| Immigrants | Armenia | 96.9 /100 | #92 | Exceptional 12.6% |
| Palestinians | 96.9 /100 | #93 | Exceptional 12.6% |
| Immigrants | France | 96.8 /100 | #94 | Exceptional 12.6% |
| Ukrainians | 96.7 /100 | #95 | Exceptional 12.6% |
| Immigrants | Zimbabwe | 96.7 /100 | #96 | Exceptional 12.6% |
| Immigrants | Northern Africa | 96.6 /100 | #97 | Exceptional 12.6% |
| Immigrants | Ethiopia | 96.5 /100 | #98 | Exceptional 12.6% |
| Immigrants | Argentina | 96.4 /100 | #99 | Exceptional 12.6% |
| Immigrants | Denmark | 95.7 /100 | #100 | Exceptional 12.7% |
| Immigrants | Switzerland | 95.7 /100 | #101 | Exceptional 12.7% |
| Peruvians | 95.6 /100 | #102 | Exceptional 12.7% |
| Immigrants | Spain | 95.5 /100 | #103 | Exceptional 12.7% |
Demographics Similar to Immigrants from South Central Asia by Female Poverty Among 25-34 Year Olds
In terms of female poverty among 25-34 year olds, the demographic groups most similar to Immigrants from South Central Asia are Chinese (11.0%, a difference of 2.0%), Immigrants from Iran (11.0%, a difference of 2.7%), Immigrants from Singapore (11.1%, a difference of 3.0%), Immigrants from Lithuania (11.1%, a difference of 3.2%), and Immigrants from Hong Kong (10.4%, a difference of 3.7%).
| Demographics | Rating | Rank | Female Poverty Among 25-34 Year Olds |
| Immigrants | India | 100.0 /100 | #1 | Exceptional 9.7% |
| Immigrants | Taiwan | 100.0 /100 | #2 | Exceptional 10.0% |
| Filipinos | 100.0 /100 | #3 | Exceptional 10.2% |
| Thais | 100.0 /100 | #4 | Exceptional 10.2% |
| Immigrants | Hong Kong | 100.0 /100 | #5 | Exceptional 10.4% |
| Immigrants | South Central Asia | 100.0 /100 | #6 | Exceptional 10.8% |
| Chinese | 100.0 /100 | #7 | Exceptional 11.0% |
| Immigrants | Iran | 100.0 /100 | #8 | Exceptional 11.0% |
| Immigrants | Singapore | 100.0 /100 | #9 | Exceptional 11.1% |
| Immigrants | Lithuania | 100.0 /100 | #10 | Exceptional 11.1% |
| Immigrants | Korea | 100.0 /100 | #11 | Exceptional 11.1% |
| Immigrants | Ireland | 100.0 /100 | #12 | Exceptional 11.2% |
| Burmese | 100.0 /100 | #13 | Exceptional 11.2% |
| Indians (Asian) | 100.0 /100 | #14 | Exceptional 11.2% |
| Assyrians/Chaldeans/Syriacs | 100.0 /100 | #15 | Exceptional 11.2% |