Immigrants from Yemen vs Alaskan Athabascan Child Poverty Under the Age of 5
COMPARE
Immigrants from Yemen
Alaskan Athabascan
Child Poverty Under the Age of 5
Child Poverty Under the Age of 5 Comparison
Immigrants from Yemen
Alaskan Athabascans
29.3%
CHILD POVERTY UNDER THE AGE OF 5
0.0/ 100
METRIC RATING
341st/ 347
METRIC RANK
21.8%
CHILD POVERTY UNDER THE AGE OF 5
0.0/ 100
METRIC RATING
300th/ 347
METRIC RANK
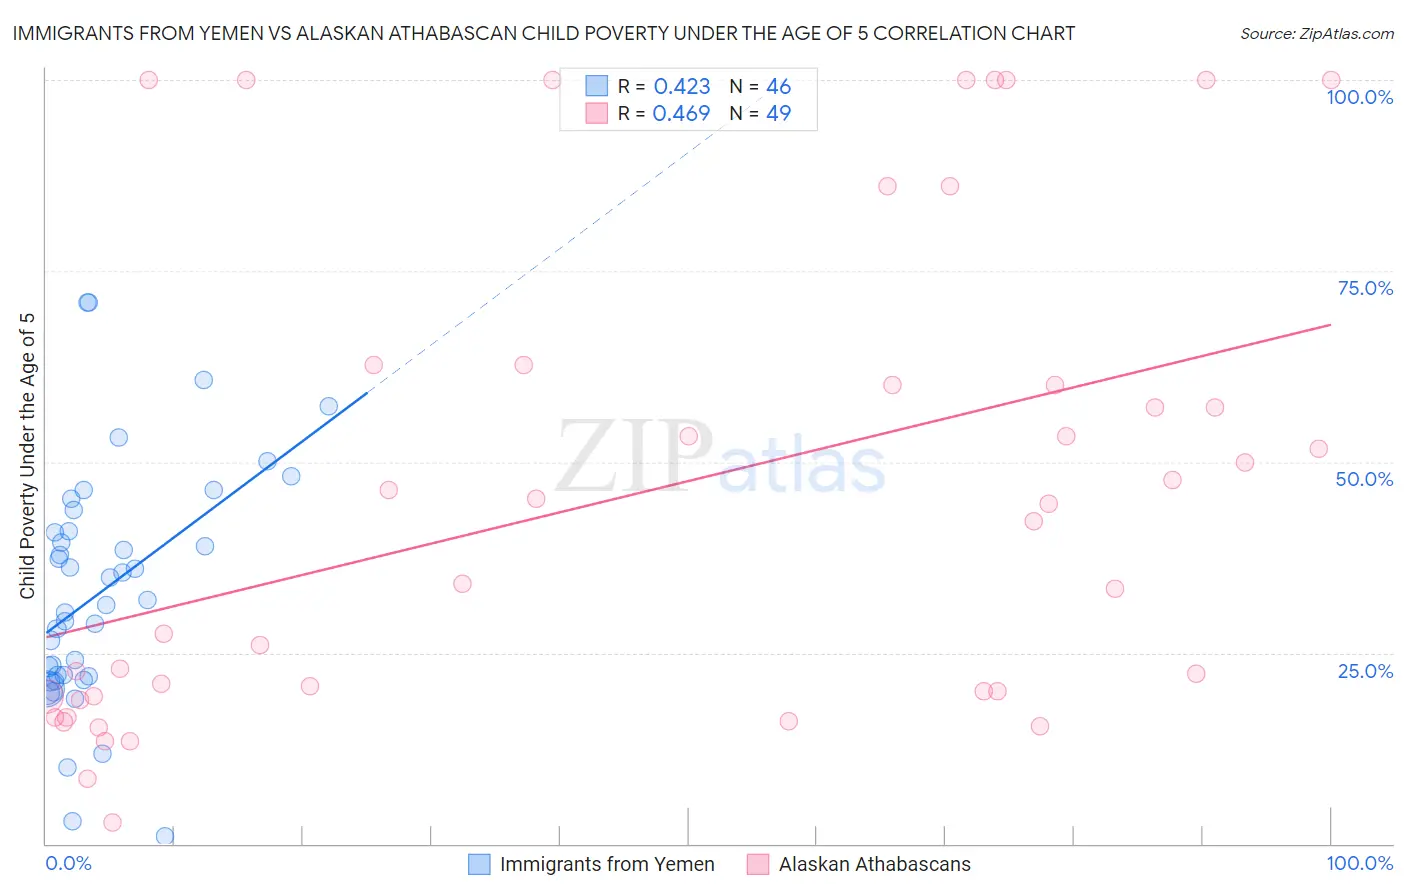
Immigrants from Yemen vs Alaskan Athabascan Child Poverty Under the Age of 5 Correlation Chart
The statistical analysis conducted on geographies consisting of 81,898,397 people shows a moderate positive correlation between the proportion of Immigrants from Yemen and poverty level among children under the age of 5 in the United States with a correlation coefficient (R) of 0.423 and weighted average of 29.3%. Similarly, the statistical analysis conducted on geographies consisting of 45,439,676 people shows a moderate positive correlation between the proportion of Alaskan Athabascans and poverty level among children under the age of 5 in the United States with a correlation coefficient (R) of 0.469 and weighted average of 21.8%, a difference of 34.3%.
Child Poverty Under the Age of 5 Correlation Summary
| Measurement | Immigrants from Yemen | Alaskan Athabascan |
| Minimum | 0.94% | 2.7% |
| Maximum | 70.9% | 100.0% |
| Range | 70.0% | 97.3% |
| Mean | 33.1% | 45.5% |
| Median | 31.6% | 42.3% |
| Interquartile 25% (IQ1) | 22.0% | 19.3% |
| Interquartile 75% (IQ3) | 40.9% | 61.3% |
| Interquartile Range (IQR) | 18.9% | 42.0% |
| Standard Deviation (Sample) | 15.5% | 31.0% |
| Standard Deviation (Population) | 15.3% | 30.7% |
Similar Demographics by Child Poverty Under the Age of 5
Demographics Similar to Immigrants from Yemen by Child Poverty Under the Age of 5
In terms of child poverty under the age of 5, the demographic groups most similar to Immigrants from Yemen are Tohono O'odham (29.5%, a difference of 0.68%), Yuman (29.5%, a difference of 0.84%), Cheyenne (28.3%, a difference of 3.4%), Yup'ik (27.7%, a difference of 5.7%), and Hopi (27.7%, a difference of 5.7%).
| Demographics | Rating | Rank | Child Poverty Under the Age of 5 |
| Natives/Alaskans | 0.0 /100 | #333 | Tragic 25.6% |
| Blacks/African Americans | 0.0 /100 | #334 | Tragic 25.7% |
| Colville | 0.0 /100 | #335 | Tragic 25.7% |
| Sioux | 0.0 /100 | #336 | Tragic 26.9% |
| Pima | 0.0 /100 | #337 | Tragic 27.4% |
| Hopi | 0.0 /100 | #338 | Tragic 27.7% |
| Yup'ik | 0.0 /100 | #339 | Tragic 27.7% |
| Cheyenne | 0.0 /100 | #340 | Tragic 28.3% |
| Immigrants | Yemen | 0.0 /100 | #341 | Tragic 29.3% |
| Tohono O'odham | 0.0 /100 | #342 | Tragic 29.5% |
| Yuman | 0.0 /100 | #343 | Tragic 29.5% |
| Crow | 0.0 /100 | #344 | Tragic 31.0% |
| Navajo | 0.0 /100 | #345 | Tragic 31.6% |
| Lumbee | 0.0 /100 | #346 | Tragic 33.3% |
| Puerto Ricans | 0.0 /100 | #347 | Tragic 34.5% |
Demographics Similar to Alaskan Athabascans by Child Poverty Under the Age of 5
In terms of child poverty under the age of 5, the demographic groups most similar to Alaskan Athabascans are Blackfeet (21.8%, a difference of 0.010%), Chickasaw (21.8%, a difference of 0.010%), Hispanic or Latino (21.7%, a difference of 0.40%), Yaqui (21.7%, a difference of 0.41%), and Cherokee (21.7%, a difference of 0.57%).
| Demographics | Rating | Rank | Child Poverty Under the Age of 5 |
| Mexicans | 0.0 /100 | #293 | Tragic 21.6% |
| Guatemalans | 0.0 /100 | #294 | Tragic 21.6% |
| Cherokee | 0.0 /100 | #295 | Tragic 21.7% |
| Yaqui | 0.0 /100 | #296 | Tragic 21.7% |
| Hispanics or Latinos | 0.0 /100 | #297 | Tragic 21.7% |
| Blackfeet | 0.0 /100 | #298 | Tragic 21.8% |
| Chickasaw | 0.0 /100 | #299 | Tragic 21.8% |
| Alaskan Athabascans | 0.0 /100 | #300 | Tragic 21.8% |
| Immigrants | Central America | 0.0 /100 | #301 | Tragic 22.0% |
| Iroquois | 0.0 /100 | #302 | Tragic 22.0% |
| Inupiat | 0.0 /100 | #303 | Tragic 22.0% |
| Immigrants | Guatemala | 0.0 /100 | #304 | Tragic 22.0% |
| Immigrants | Mexico | 0.0 /100 | #305 | Tragic 22.2% |
| Indonesians | 0.0 /100 | #306 | Tragic 22.3% |
| Immigrants | Bahamas | 0.0 /100 | #307 | Tragic 22.7% |