Immigrants from Western Europe vs Pueblo Female Poverty
COMPARE
Immigrants from Western Europe
Pueblo
Female Poverty
Female Poverty Comparison
Immigrants from Western Europe
Pueblo
12.8%
FEMALE POVERTY
86.6/ 100
METRIC RATING
133rd/ 347
METRIC RANK
20.7%
FEMALE POVERTY
0.0/ 100
METRIC RATING
336th/ 347
METRIC RANK
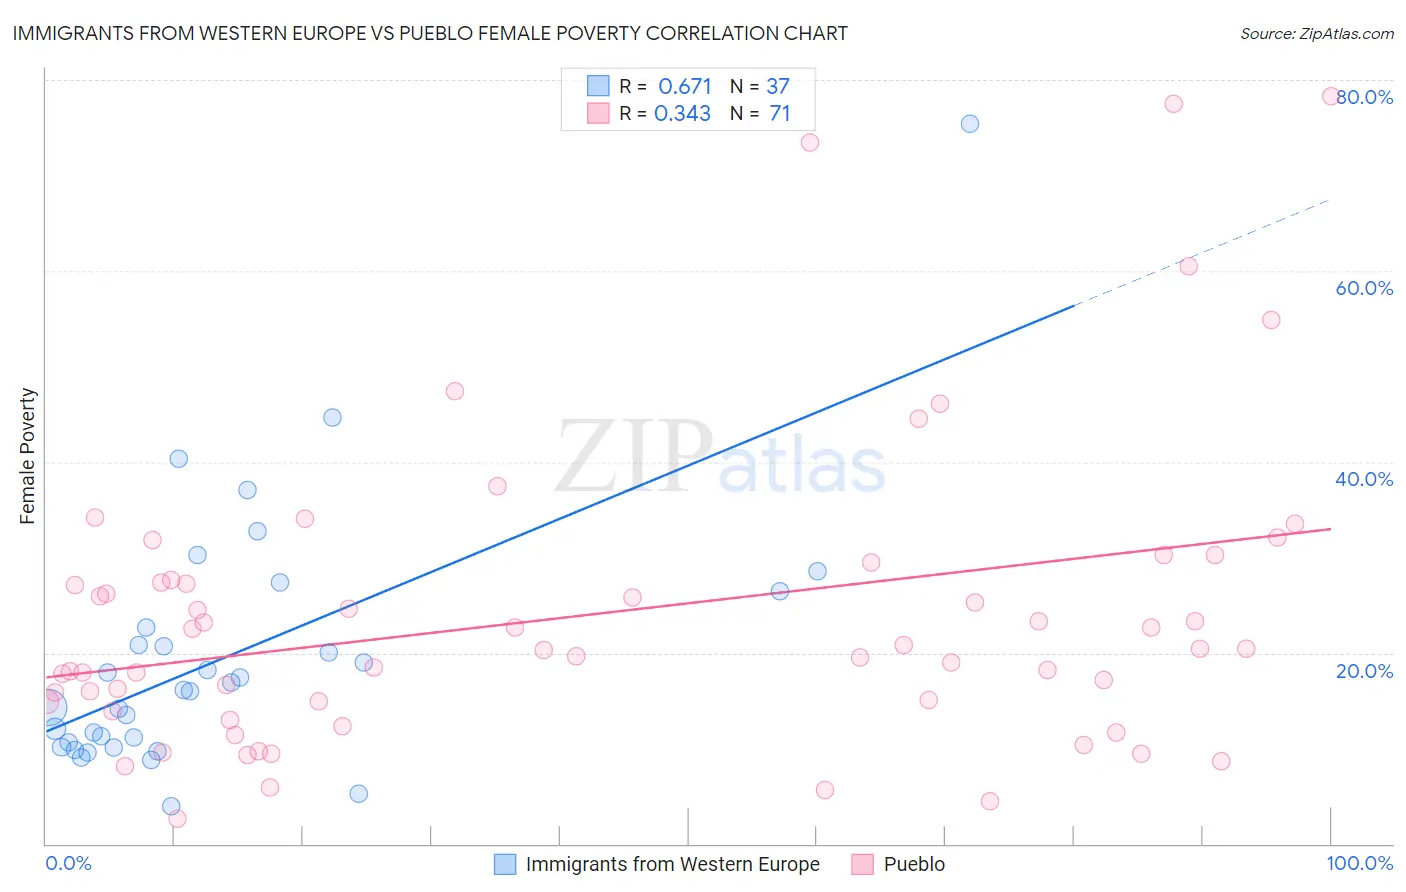
Immigrants from Western Europe vs Pueblo Female Poverty Correlation Chart
The statistical analysis conducted on geographies consisting of 493,604,679 people shows a significant positive correlation between the proportion of Immigrants from Western Europe and poverty level among females in the United States with a correlation coefficient (R) of 0.671 and weighted average of 12.8%. Similarly, the statistical analysis conducted on geographies consisting of 120,063,316 people shows a mild positive correlation between the proportion of Pueblo and poverty level among females in the United States with a correlation coefficient (R) of 0.343 and weighted average of 20.7%, a difference of 61.0%.
Female Poverty Correlation Summary
| Measurement | Immigrants from Western Europe | Pueblo |
| Minimum | 4.0% | 2.6% |
| Maximum | 75.4% | 78.3% |
| Range | 71.4% | 75.6% |
| Mean | 19.6% | 24.0% |
| Median | 16.1% | 20.4% |
| Interquartile 25% (IQ1) | 10.4% | 14.9% |
| Interquartile 75% (IQ3) | 24.5% | 27.6% |
| Interquartile Range (IQR) | 14.2% | 12.7% |
| Standard Deviation (Sample) | 13.5% | 15.8% |
| Standard Deviation (Population) | 13.4% | 15.7% |
Similar Demographics by Female Poverty
Demographics Similar to Immigrants from Western Europe by Female Poverty
In terms of female poverty, the demographic groups most similar to Immigrants from Western Europe are Immigrants from Jordan (12.8%, a difference of 0.060%), Immigrants from Argentina (12.8%, a difference of 0.070%), Immigrants from Vietnam (12.8%, a difference of 0.11%), Immigrants from Switzerland (12.9%, a difference of 0.16%), and French (12.9%, a difference of 0.22%).
| Demographics | Rating | Rank | Female Poverty |
| Immigrants | Ukraine | 88.8 /100 | #126 | Excellent 12.8% |
| South Africans | 88.4 /100 | #127 | Excellent 12.8% |
| Immigrants | Belarus | 88.2 /100 | #128 | Excellent 12.8% |
| Immigrants | Brazil | 87.9 /100 | #129 | Excellent 12.8% |
| Immigrants | Vietnam | 87.1 /100 | #130 | Excellent 12.8% |
| Immigrants | Argentina | 87.0 /100 | #131 | Excellent 12.8% |
| Immigrants | Jordan | 86.9 /100 | #132 | Excellent 12.8% |
| Immigrants | Western Europe | 86.6 /100 | #133 | Excellent 12.8% |
| Immigrants | Switzerland | 85.8 /100 | #134 | Excellent 12.9% |
| French | 85.6 /100 | #135 | Excellent 12.9% |
| Peruvians | 85.2 /100 | #136 | Excellent 12.9% |
| Chileans | 84.7 /100 | #137 | Excellent 12.9% |
| Immigrants | France | 83.6 /100 | #138 | Excellent 12.9% |
| Basques | 83.1 /100 | #139 | Excellent 12.9% |
| Pakistanis | 83.0 /100 | #140 | Excellent 12.9% |
Demographics Similar to Pueblo by Female Poverty
In terms of female poverty, the demographic groups most similar to Pueblo are Yuman (20.8%, a difference of 0.81%), Sioux (20.9%, a difference of 1.0%), Hopi (21.0%, a difference of 1.4%), Cheyenne (20.2%, a difference of 2.4%), and Houma (20.0%, a difference of 3.2%).
| Demographics | Rating | Rank | Female Poverty |
| Kiowa | 0.0 /100 | #329 | Tragic 18.6% |
| Dominicans | 0.0 /100 | #330 | Tragic 19.1% |
| Natives/Alaskans | 0.0 /100 | #331 | Tragic 19.2% |
| Apache | 0.0 /100 | #332 | Tragic 19.2% |
| Immigrants | Dominican Republic | 0.0 /100 | #333 | Tragic 19.3% |
| Houma | 0.0 /100 | #334 | Tragic 20.0% |
| Cheyenne | 0.0 /100 | #335 | Tragic 20.2% |
| Pueblo | 0.0 /100 | #336 | Tragic 20.7% |
| Yuman | 0.0 /100 | #337 | Tragic 20.8% |
| Sioux | 0.0 /100 | #338 | Tragic 20.9% |
| Hopi | 0.0 /100 | #339 | Tragic 21.0% |
| Yup'ik | 0.0 /100 | #340 | Tragic 21.5% |
| Crow | 0.0 /100 | #341 | Tragic 22.1% |
| Immigrants | Yemen | 0.0 /100 | #342 | Tragic 22.8% |
| Lumbee | 0.0 /100 | #343 | Tragic 23.5% |