Immigrants from Western Europe vs German Family Poverty
COMPARE
Immigrants from Western Europe
German
Family Poverty
Family Poverty Comparison
Immigrants from Western Europe
Germans
8.2%
FAMILY POVERTY
92.9/ 100
METRIC RATING
118th/ 347
METRIC RANK
7.7%
FAMILY POVERTY
99.0/ 100
METRIC RATING
44th/ 347
METRIC RANK
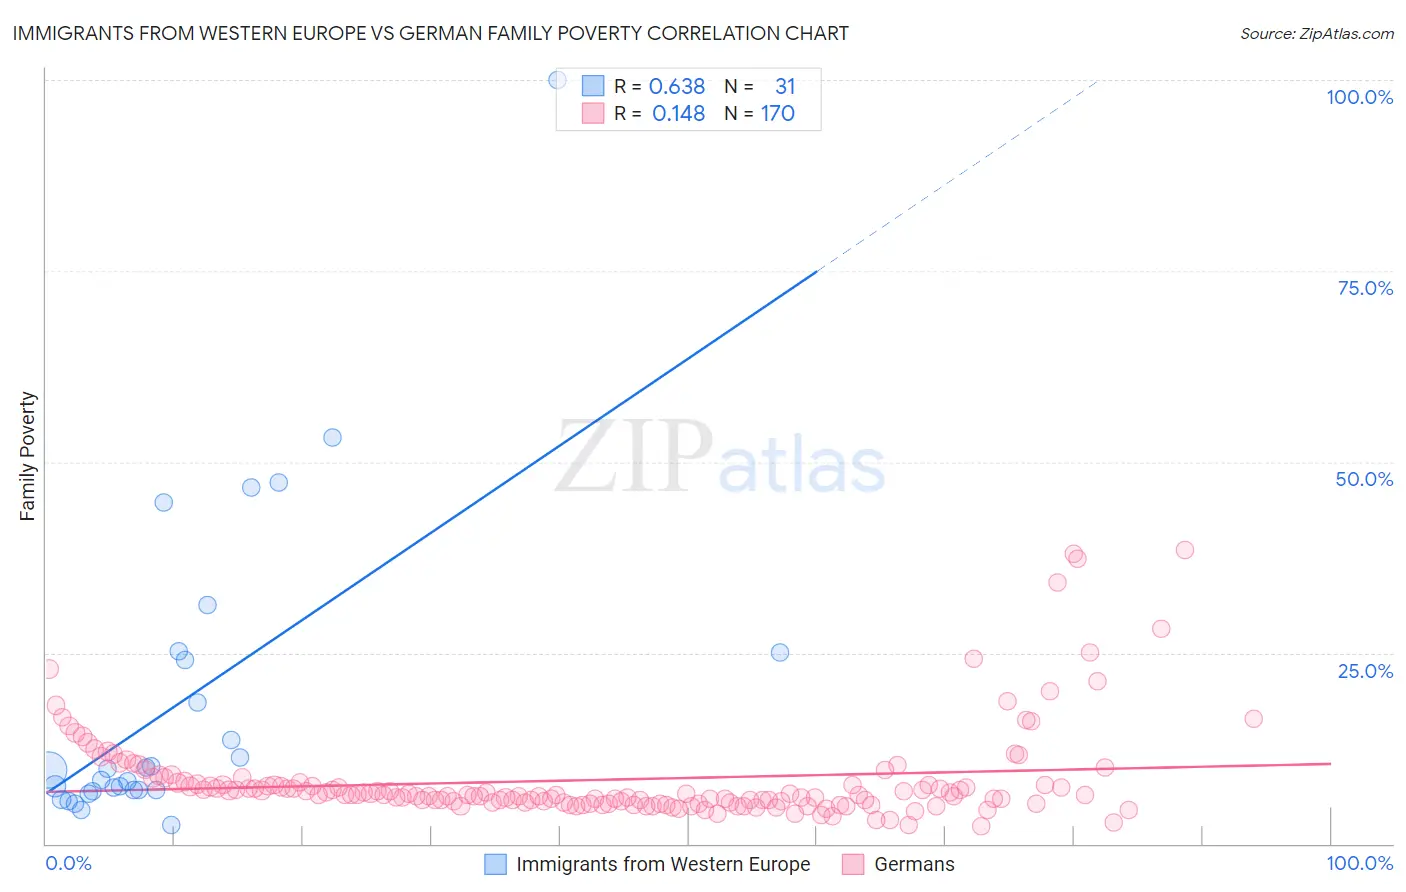
Immigrants from Western Europe vs German Family Poverty Correlation Chart
The statistical analysis conducted on geographies consisting of 491,859,652 people shows a significant positive correlation between the proportion of Immigrants from Western Europe and poverty level among families in the United States with a correlation coefficient (R) of 0.638 and weighted average of 8.2%. Similarly, the statistical analysis conducted on geographies consisting of 575,144,438 people shows a poor positive correlation between the proportion of Germans and poverty level among families in the United States with a correlation coefficient (R) of 0.148 and weighted average of 7.7%, a difference of 7.7%.
Family Poverty Correlation Summary
| Measurement | Immigrants from Western Europe | German |
| Minimum | 2.5% | 2.3% |
| Maximum | 100.0% | 38.5% |
| Range | 97.5% | 36.2% |
| Mean | 18.6% | 8.4% |
| Median | 9.6% | 6.4% |
| Interquartile 25% (IQ1) | 7.0% | 5.4% |
| Interquartile 75% (IQ3) | 25.0% | 7.8% |
| Interquartile Range (IQR) | 18.0% | 2.4% |
| Standard Deviation (Sample) | 20.8% | 6.1% |
| Standard Deviation (Population) | 20.5% | 6.1% |
Similar Demographics by Family Poverty
Demographics Similar to Immigrants from Western Europe by Family Poverty
In terms of family poverty, the demographic groups most similar to Immigrants from Western Europe are French (8.3%, a difference of 0.070%), Immigrants from Russia (8.2%, a difference of 0.19%), South African (8.2%, a difference of 0.26%), Immigrants from Israel (8.2%, a difference of 0.32%), and Immigrants from Egypt (8.3%, a difference of 0.63%).
| Demographics | Rating | Rank | Family Poverty |
| Taiwanese | 94.6 /100 | #111 | Exceptional 8.2% |
| Immigrants | France | 94.4 /100 | #112 | Exceptional 8.2% |
| Canadians | 94.2 /100 | #113 | Exceptional 8.2% |
| Immigrants | Zimbabwe | 94.0 /100 | #114 | Exceptional 8.2% |
| Immigrants | Israel | 93.5 /100 | #115 | Exceptional 8.2% |
| South Africans | 93.4 /100 | #116 | Exceptional 8.2% |
| Immigrants | Russia | 93.2 /100 | #117 | Exceptional 8.2% |
| Immigrants | Western Europe | 92.9 /100 | #118 | Exceptional 8.2% |
| French | 92.8 /100 | #119 | Exceptional 8.3% |
| Immigrants | Egypt | 91.6 /100 | #120 | Exceptional 8.3% |
| Native Hawaiians | 91.3 /100 | #121 | Exceptional 8.3% |
| Paraguayans | 91.2 /100 | #122 | Exceptional 8.3% |
| Palestinians | 91.1 /100 | #123 | Exceptional 8.3% |
| Soviet Union | 90.8 /100 | #124 | Exceptional 8.3% |
| Pakistanis | 90.8 /100 | #125 | Exceptional 8.3% |
Demographics Similar to Germans by Family Poverty
In terms of family poverty, the demographic groups most similar to Germans are Okinawan (7.7%, a difference of 0.12%), Tongan (7.7%, a difference of 0.14%), Immigrants from Czechoslovakia (7.7%, a difference of 0.15%), Immigrants from Sri Lanka (7.7%, a difference of 0.17%), and Immigrants from Austria (7.6%, a difference of 0.29%).
| Demographics | Rating | Rank | Family Poverty |
| Estonians | 99.4 /100 | #37 | Exceptional 7.5% |
| Bolivians | 99.3 /100 | #38 | Exceptional 7.5% |
| Carpatho Rusyns | 99.3 /100 | #39 | Exceptional 7.5% |
| Slovenes | 99.3 /100 | #40 | Exceptional 7.5% |
| Immigrants | Australia | 99.2 /100 | #41 | Exceptional 7.6% |
| Scandinavians | 99.1 /100 | #42 | Exceptional 7.6% |
| Immigrants | Austria | 99.1 /100 | #43 | Exceptional 7.6% |
| Germans | 99.0 /100 | #44 | Exceptional 7.7% |
| Okinawans | 98.9 /100 | #45 | Exceptional 7.7% |
| Tongans | 98.9 /100 | #46 | Exceptional 7.7% |
| Immigrants | Czechoslovakia | 98.9 /100 | #47 | Exceptional 7.7% |
| Immigrants | Sri Lanka | 98.9 /100 | #48 | Exceptional 7.7% |
| Immigrants | Bolivia | 98.9 /100 | #49 | Exceptional 7.7% |
| Immigrants | North Macedonia | 98.9 /100 | #50 | Exceptional 7.7% |
| Immigrants | Moldova | 98.8 /100 | #51 | Exceptional 7.7% |