Immigrants from Germany vs German Family Poverty
COMPARE
Immigrants from Germany
German
Family Poverty
Family Poverty Comparison
Immigrants from Germany
Germans
8.5%
FAMILY POVERTY
83.3/ 100
METRIC RATING
143rd/ 347
METRIC RANK
7.7%
FAMILY POVERTY
99.0/ 100
METRIC RATING
44th/ 347
METRIC RANK
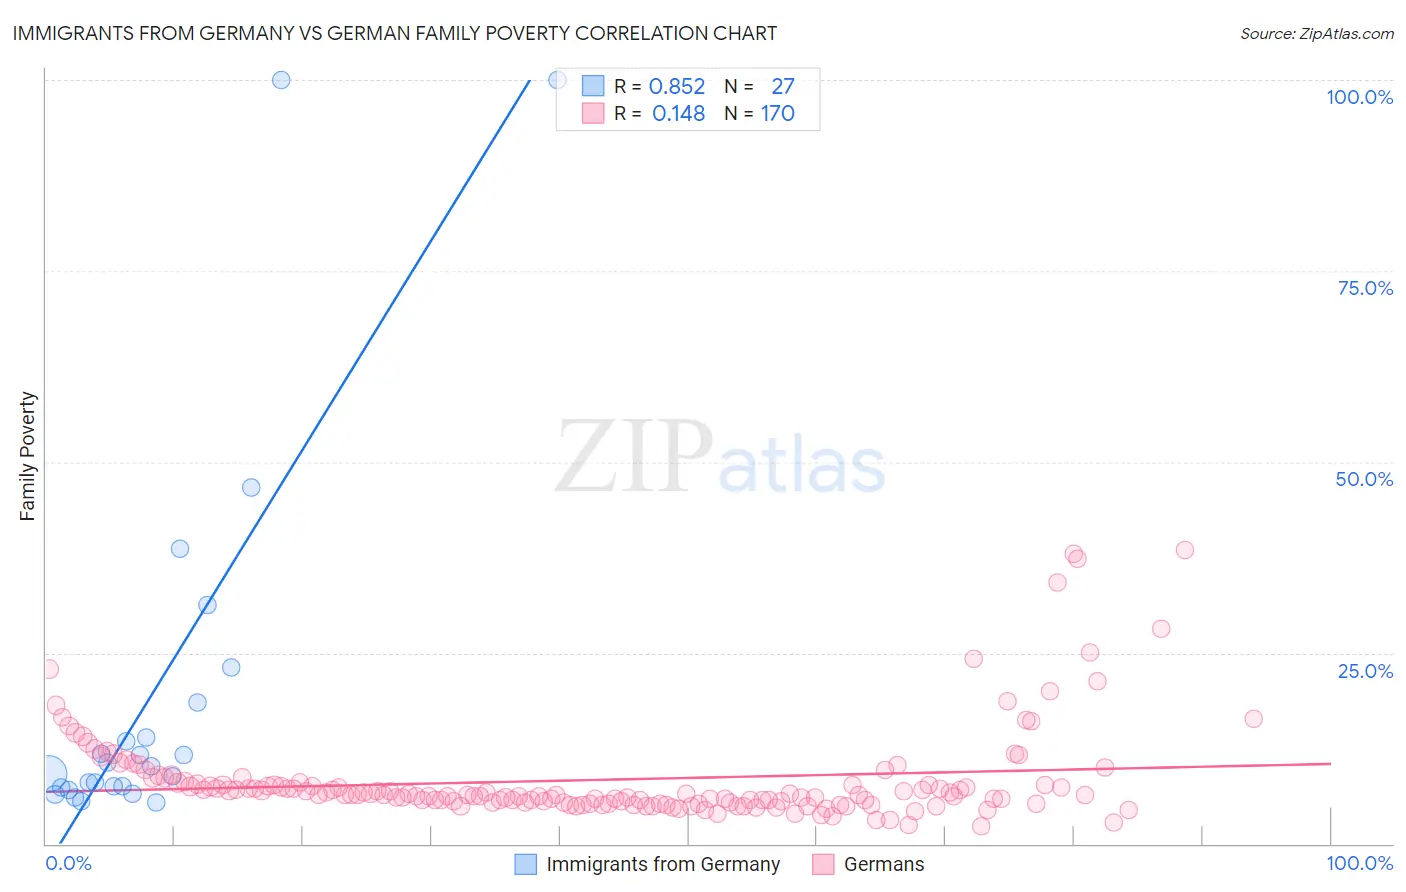
Immigrants from Germany vs German Family Poverty Correlation Chart
The statistical analysis conducted on geographies consisting of 462,312,893 people shows a very strong positive correlation between the proportion of Immigrants from Germany and poverty level among families in the United States with a correlation coefficient (R) of 0.852 and weighted average of 8.5%. Similarly, the statistical analysis conducted on geographies consisting of 575,144,438 people shows a poor positive correlation between the proportion of Germans and poverty level among families in the United States with a correlation coefficient (R) of 0.148 and weighted average of 7.7%, a difference of 11.4%.
Family Poverty Correlation Summary
| Measurement | Immigrants from Germany | German |
| Minimum | 5.4% | 2.3% |
| Maximum | 100.0% | 38.5% |
| Range | 94.6% | 36.2% |
| Mean | 19.8% | 8.4% |
| Median | 10.2% | 6.4% |
| Interquartile 25% (IQ1) | 7.3% | 5.4% |
| Interquartile 75% (IQ3) | 18.4% | 7.8% |
| Interquartile Range (IQR) | 11.1% | 2.4% |
| Standard Deviation (Sample) | 25.3% | 6.1% |
| Standard Deviation (Population) | 24.8% | 6.1% |
Similar Demographics by Family Poverty
Demographics Similar to Immigrants from Germany by Family Poverty
In terms of family poverty, the demographic groups most similar to Immigrants from Germany are Albanian (8.5%, a difference of 0.020%), Yugoslavian (8.5%, a difference of 0.030%), Immigrants from South Eastern Asia (8.5%, a difference of 0.040%), Immigrants from Belarus (8.5%, a difference of 0.050%), and Immigrants from Jordan (8.5%, a difference of 0.080%).
| Demographics | Rating | Rank | Family Poverty |
| Immigrants | Brazil | 86.3 /100 | #136 | Excellent 8.5% |
| Immigrants | Southern Europe | 86.0 /100 | #137 | Excellent 8.5% |
| Armenians | 84.6 /100 | #138 | Excellent 8.5% |
| Immigrants | Nepal | 84.2 /100 | #139 | Excellent 8.5% |
| Immigrants | Kazakhstan | 84.1 /100 | #140 | Excellent 8.5% |
| Immigrants | Ukraine | 83.9 /100 | #141 | Excellent 8.5% |
| Yugoslavians | 83.5 /100 | #142 | Excellent 8.5% |
| Immigrants | Germany | 83.3 /100 | #143 | Excellent 8.5% |
| Albanians | 83.3 /100 | #144 | Excellent 8.5% |
| Immigrants | South Eastern Asia | 83.2 /100 | #145 | Excellent 8.5% |
| Immigrants | Belarus | 83.2 /100 | #146 | Excellent 8.5% |
| Immigrants | Jordan | 83.0 /100 | #147 | Excellent 8.5% |
| Scotch-Irish | 82.2 /100 | #148 | Excellent 8.6% |
| Mongolians | 80.4 /100 | #149 | Excellent 8.6% |
| Syrians | 80.3 /100 | #150 | Excellent 8.6% |
Demographics Similar to Germans by Family Poverty
In terms of family poverty, the demographic groups most similar to Germans are Okinawan (7.7%, a difference of 0.12%), Tongan (7.7%, a difference of 0.14%), Immigrants from Czechoslovakia (7.7%, a difference of 0.15%), Immigrants from Sri Lanka (7.7%, a difference of 0.17%), and Immigrants from Austria (7.6%, a difference of 0.29%).
| Demographics | Rating | Rank | Family Poverty |
| Estonians | 99.4 /100 | #37 | Exceptional 7.5% |
| Bolivians | 99.3 /100 | #38 | Exceptional 7.5% |
| Carpatho Rusyns | 99.3 /100 | #39 | Exceptional 7.5% |
| Slovenes | 99.3 /100 | #40 | Exceptional 7.5% |
| Immigrants | Australia | 99.2 /100 | #41 | Exceptional 7.6% |
| Scandinavians | 99.1 /100 | #42 | Exceptional 7.6% |
| Immigrants | Austria | 99.1 /100 | #43 | Exceptional 7.6% |
| Germans | 99.0 /100 | #44 | Exceptional 7.7% |
| Okinawans | 98.9 /100 | #45 | Exceptional 7.7% |
| Tongans | 98.9 /100 | #46 | Exceptional 7.7% |
| Immigrants | Czechoslovakia | 98.9 /100 | #47 | Exceptional 7.7% |
| Immigrants | Sri Lanka | 98.9 /100 | #48 | Exceptional 7.7% |
| Immigrants | Bolivia | 98.9 /100 | #49 | Exceptional 7.7% |
| Immigrants | North Macedonia | 98.9 /100 | #50 | Exceptional 7.7% |
| Immigrants | Moldova | 98.8 /100 | #51 | Exceptional 7.7% |