Immigrants from Western Asia vs Basque Family Poverty
COMPARE
Immigrants from Western Asia
Basque
Family Poverty
Family Poverty Comparison
Immigrants from Western Asia
Basques
9.3%
FAMILY POVERTY
28.2/ 100
METRIC RATING
193rd/ 347
METRIC RANK
8.1%
FAMILY POVERTY
94.9/ 100
METRIC RATING
108th/ 347
METRIC RANK
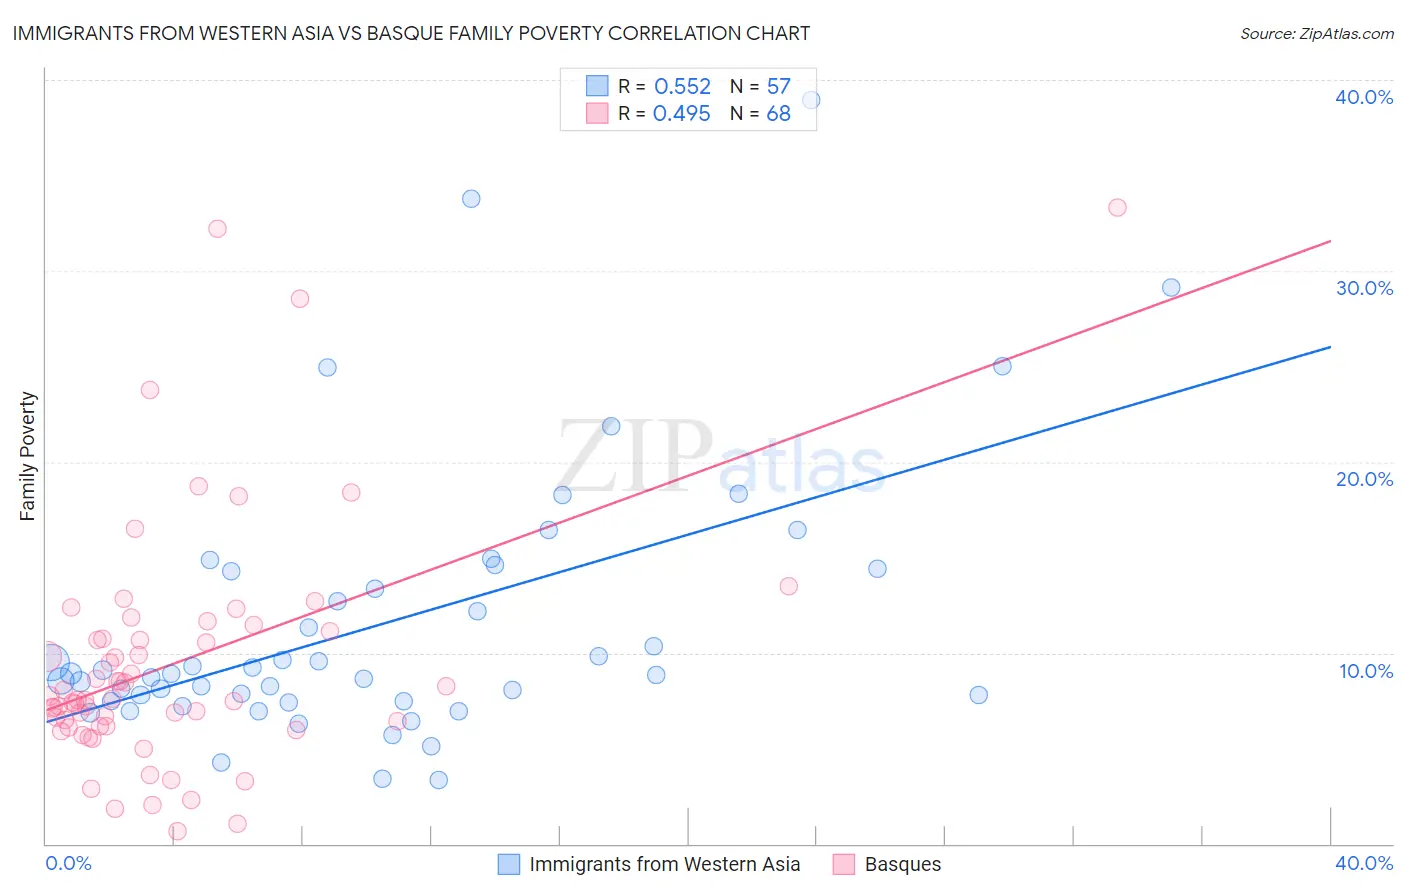
Immigrants from Western Asia vs Basque Family Poverty Correlation Chart
The statistical analysis conducted on geographies consisting of 403,212,379 people shows a substantial positive correlation between the proportion of Immigrants from Western Asia and poverty level among families in the United States with a correlation coefficient (R) of 0.552 and weighted average of 9.3%. Similarly, the statistical analysis conducted on geographies consisting of 165,603,932 people shows a moderate positive correlation between the proportion of Basques and poverty level among families in the United States with a correlation coefficient (R) of 0.495 and weighted average of 8.1%, a difference of 14.0%.
Family Poverty Correlation Summary
| Measurement | Immigrants from Western Asia | Basque |
| Minimum | 3.3% | 0.66% |
| Maximum | 38.9% | 33.3% |
| Range | 35.6% | 32.7% |
| Mean | 11.6% | 9.4% |
| Median | 8.9% | 7.6% |
| Interquartile 25% (IQ1) | 7.5% | 6.2% |
| Interquartile 75% (IQ3) | 14.3% | 10.9% |
| Interquartile Range (IQR) | 6.9% | 4.8% |
| Standard Deviation (Sample) | 7.2% | 6.4% |
| Standard Deviation (Population) | 7.1% | 6.3% |
Similar Demographics by Family Poverty
Demographics Similar to Immigrants from Western Asia by Family Poverty
In terms of family poverty, the demographic groups most similar to Immigrants from Western Asia are South American (9.3%, a difference of 0.020%), Spanish (9.3%, a difference of 0.070%), Ugandan (9.3%, a difference of 0.080%), Venezuelan (9.3%, a difference of 0.13%), and Immigrants from Venezuela (9.3%, a difference of 0.34%).
| Demographics | Rating | Rank | Family Poverty |
| Colombians | 36.1 /100 | #186 | Fair 9.2% |
| Delaware | 35.4 /100 | #187 | Fair 9.2% |
| Immigrants | Kenya | 34.0 /100 | #188 | Fair 9.2% |
| Immigrants | Afghanistan | 32.1 /100 | #189 | Fair 9.2% |
| Arabs | 31.5 /100 | #190 | Fair 9.2% |
| Ugandans | 28.7 /100 | #191 | Fair 9.3% |
| Spanish | 28.7 /100 | #192 | Fair 9.3% |
| Immigrants | Western Asia | 28.2 /100 | #193 | Fair 9.3% |
| South Americans | 28.1 /100 | #194 | Fair 9.3% |
| Venezuelans | 27.4 /100 | #195 | Fair 9.3% |
| Immigrants | Venezuela | 26.1 /100 | #196 | Fair 9.3% |
| Immigrants | Colombia | 24.4 /100 | #197 | Fair 9.3% |
| Iraqis | 24.2 /100 | #198 | Fair 9.3% |
| Spaniards | 22.8 /100 | #199 | Fair 9.4% |
| Immigrants | Costa Rica | 21.7 /100 | #200 | Fair 9.4% |
Demographics Similar to Basques by Family Poverty
In terms of family poverty, the demographic groups most similar to Basques are French Canadian (8.1%, a difference of 0.090%), Jordanian (8.2%, a difference of 0.090%), Egyptian (8.1%, a difference of 0.13%), Romanian (8.2%, a difference of 0.18%), and Taiwanese (8.2%, a difference of 0.23%).
| Demographics | Rating | Rank | Family Poverty |
| Immigrants | Norway | 95.7 /100 | #101 | Exceptional 8.1% |
| Immigrants | Indonesia | 95.7 /100 | #102 | Exceptional 8.1% |
| Immigrants | Eastern Europe | 95.6 /100 | #103 | Exceptional 8.1% |
| Slavs | 95.6 /100 | #104 | Exceptional 8.1% |
| Laotians | 95.6 /100 | #105 | Exceptional 8.1% |
| Egyptians | 95.1 /100 | #106 | Exceptional 8.1% |
| French Canadians | 95.0 /100 | #107 | Exceptional 8.1% |
| Basques | 94.9 /100 | #108 | Exceptional 8.1% |
| Jordanians | 94.8 /100 | #109 | Exceptional 8.2% |
| Romanians | 94.7 /100 | #110 | Exceptional 8.2% |
| Taiwanese | 94.6 /100 | #111 | Exceptional 8.2% |
| Immigrants | France | 94.4 /100 | #112 | Exceptional 8.2% |
| Canadians | 94.2 /100 | #113 | Exceptional 8.2% |
| Immigrants | Zimbabwe | 94.0 /100 | #114 | Exceptional 8.2% |
| Immigrants | Israel | 93.5 /100 | #115 | Exceptional 8.2% |