Immigrants from Barbados vs Basque Family Poverty
COMPARE
Immigrants from Barbados
Basque
Family Poverty
Family Poverty Comparison
Immigrants from Barbados
Basques
11.5%
FAMILY POVERTY
0.0/ 100
METRIC RATING
289th/ 347
METRIC RANK
8.1%
FAMILY POVERTY
94.9/ 100
METRIC RATING
108th/ 347
METRIC RANK
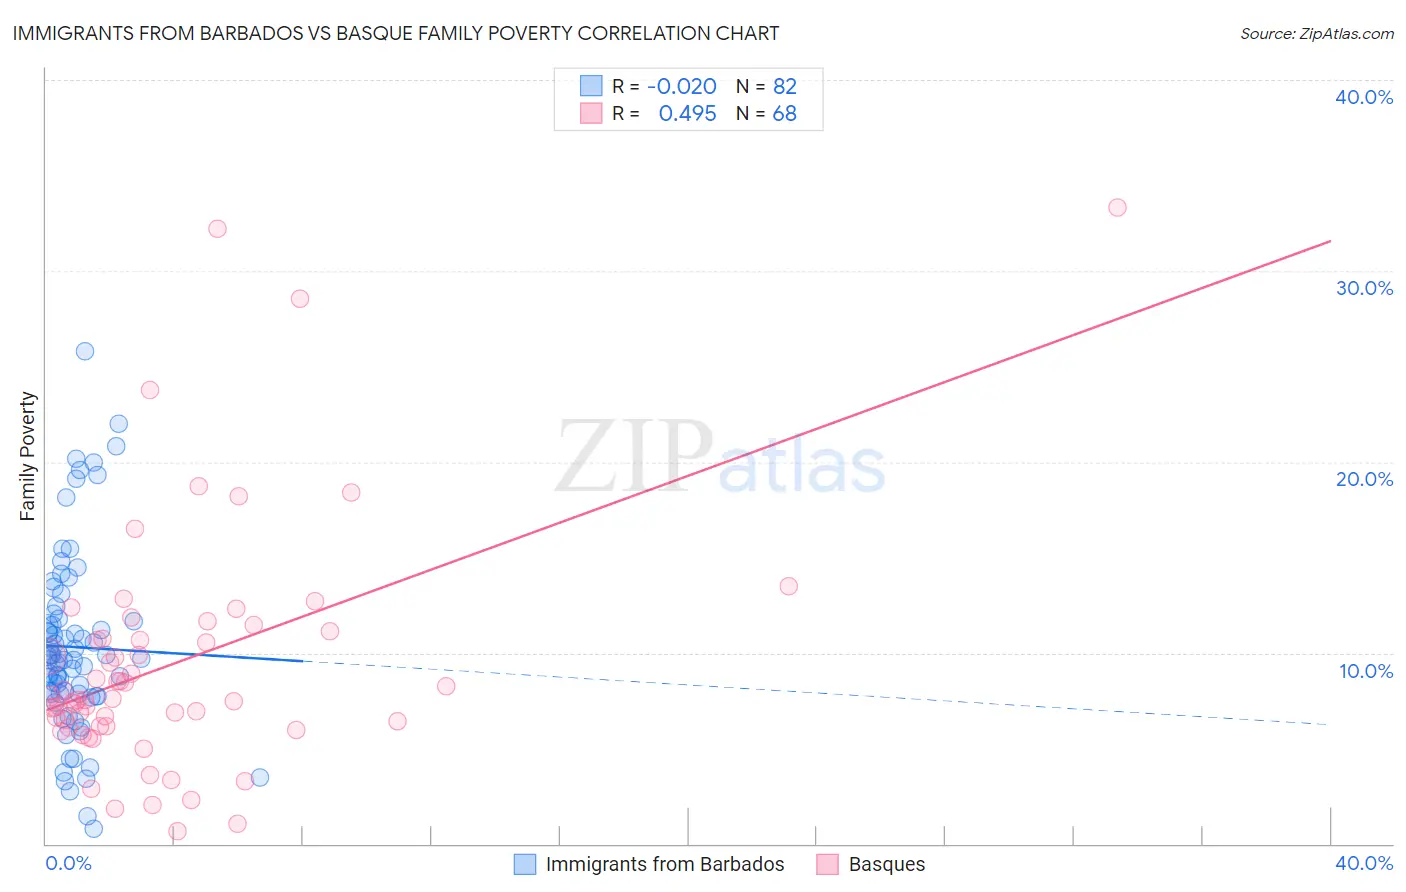
Immigrants from Barbados vs Basque Family Poverty Correlation Chart
The statistical analysis conducted on geographies consisting of 112,741,244 people shows no correlation between the proportion of Immigrants from Barbados and poverty level among families in the United States with a correlation coefficient (R) of -0.020 and weighted average of 11.5%. Similarly, the statistical analysis conducted on geographies consisting of 165,603,932 people shows a moderate positive correlation between the proportion of Basques and poverty level among families in the United States with a correlation coefficient (R) of 0.495 and weighted average of 8.1%, a difference of 41.5%.
Family Poverty Correlation Summary
| Measurement | Immigrants from Barbados | Basque |
| Minimum | 0.78% | 0.66% |
| Maximum | 25.8% | 33.3% |
| Range | 25.0% | 32.7% |
| Mean | 10.3% | 9.4% |
| Median | 9.7% | 7.6% |
| Interquartile 25% (IQ1) | 7.8% | 6.2% |
| Interquartile 75% (IQ3) | 11.8% | 10.9% |
| Interquartile Range (IQR) | 4.0% | 4.8% |
| Standard Deviation (Sample) | 4.8% | 6.4% |
| Standard Deviation (Population) | 4.8% | 6.3% |
Similar Demographics by Family Poverty
Demographics Similar to Immigrants from Barbados by Family Poverty
In terms of family poverty, the demographic groups most similar to Immigrants from Barbados are West Indian (11.5%, a difference of 0.010%), Immigrants from Belize (11.5%, a difference of 0.050%), Haitian (11.5%, a difference of 0.070%), Immigrants from Somalia (11.5%, a difference of 0.18%), and Vietnamese (11.5%, a difference of 0.24%).
| Demographics | Rating | Rank | Family Poverty |
| Immigrants | Cuba | 0.0 /100 | #282 | Tragic 11.3% |
| Indonesians | 0.0 /100 | #283 | Tragic 11.3% |
| Yaqui | 0.0 /100 | #284 | Tragic 11.3% |
| Barbadians | 0.0 /100 | #285 | Tragic 11.3% |
| Senegalese | 0.0 /100 | #286 | Tragic 11.5% |
| Vietnamese | 0.0 /100 | #287 | Tragic 11.5% |
| Immigrants | Belize | 0.0 /100 | #288 | Tragic 11.5% |
| Immigrants | Barbados | 0.0 /100 | #289 | Tragic 11.5% |
| West Indians | 0.0 /100 | #290 | Tragic 11.5% |
| Haitians | 0.0 /100 | #291 | Tragic 11.5% |
| Immigrants | Somalia | 0.0 /100 | #292 | Tragic 11.5% |
| Immigrants | Cabo Verde | 0.0 /100 | #293 | Tragic 11.6% |
| Immigrants | St. Vincent and the Grenadines | 0.0 /100 | #294 | Tragic 11.6% |
| Immigrants | Haiti | 0.0 /100 | #295 | Tragic 11.6% |
| Choctaw | 0.0 /100 | #296 | Tragic 11.6% |
Demographics Similar to Basques by Family Poverty
In terms of family poverty, the demographic groups most similar to Basques are French Canadian (8.1%, a difference of 0.090%), Jordanian (8.2%, a difference of 0.090%), Egyptian (8.1%, a difference of 0.13%), Romanian (8.2%, a difference of 0.18%), and Taiwanese (8.2%, a difference of 0.23%).
| Demographics | Rating | Rank | Family Poverty |
| Immigrants | Norway | 95.7 /100 | #101 | Exceptional 8.1% |
| Immigrants | Indonesia | 95.7 /100 | #102 | Exceptional 8.1% |
| Immigrants | Eastern Europe | 95.6 /100 | #103 | Exceptional 8.1% |
| Slavs | 95.6 /100 | #104 | Exceptional 8.1% |
| Laotians | 95.6 /100 | #105 | Exceptional 8.1% |
| Egyptians | 95.1 /100 | #106 | Exceptional 8.1% |
| French Canadians | 95.0 /100 | #107 | Exceptional 8.1% |
| Basques | 94.9 /100 | #108 | Exceptional 8.1% |
| Jordanians | 94.8 /100 | #109 | Exceptional 8.2% |
| Romanians | 94.7 /100 | #110 | Exceptional 8.2% |
| Taiwanese | 94.6 /100 | #111 | Exceptional 8.2% |
| Immigrants | France | 94.4 /100 | #112 | Exceptional 8.2% |
| Canadians | 94.2 /100 | #113 | Exceptional 8.2% |
| Immigrants | Zimbabwe | 94.0 /100 | #114 | Exceptional 8.2% |
| Immigrants | Israel | 93.5 /100 | #115 | Exceptional 8.2% |