Immigrants from West Indies vs Albanian Child Poverty Among Girls Under 16
COMPARE
Immigrants from West Indies
Albanian
Child Poverty Among Girls Under 16
Child Poverty Among Girls Under 16 Comparison
Immigrants from West Indies
Albanians
20.7%
CHILD POVERTY AMONG GIRLS UNDER 16
0.0/ 100
METRIC RATING
296th/ 347
METRIC RANK
15.4%
CHILD POVERTY AMONG GIRLS UNDER 16
90.5/ 100
METRIC RATING
128th/ 347
METRIC RANK
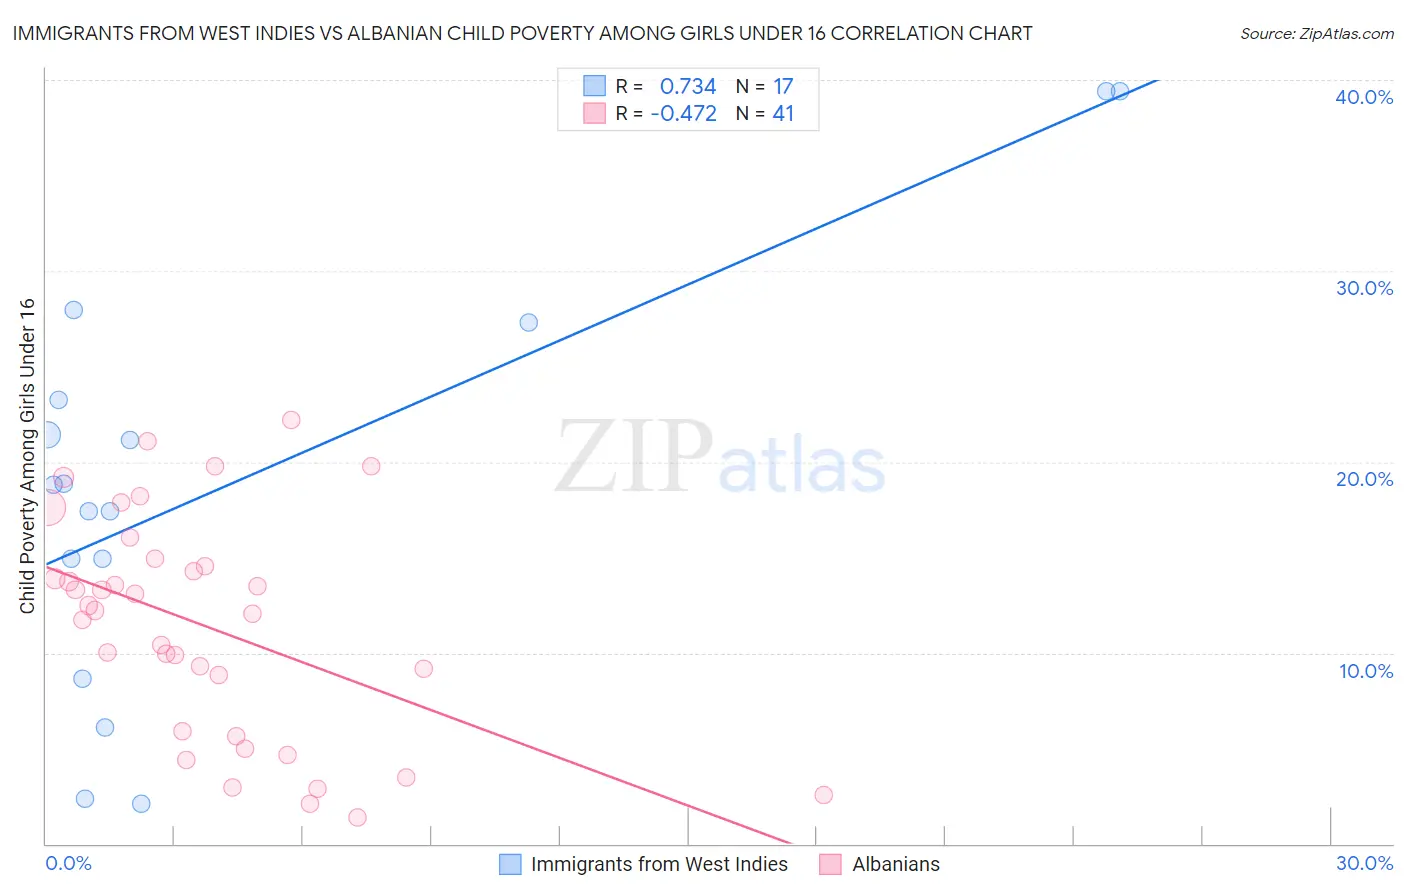
Immigrants from West Indies vs Albanian Child Poverty Among Girls Under 16 Correlation Chart
The statistical analysis conducted on geographies consisting of 72,353,904 people shows a strong positive correlation between the proportion of Immigrants from West Indies and poverty level among girls under the age of 16 in the United States with a correlation coefficient (R) of 0.734 and weighted average of 20.7%. Similarly, the statistical analysis conducted on geographies consisting of 190,280,277 people shows a moderate negative correlation between the proportion of Albanians and poverty level among girls under the age of 16 in the United States with a correlation coefficient (R) of -0.472 and weighted average of 15.4%, a difference of 34.7%.
Child Poverty Among Girls Under 16 Correlation Summary
| Measurement | Immigrants from West Indies | Albanian |
| Minimum | 2.1% | 1.4% |
| Maximum | 39.4% | 22.2% |
| Range | 37.3% | 20.8% |
| Mean | 18.9% | 11.4% |
| Median | 18.8% | 12.2% |
| Interquartile 25% (IQ1) | 11.8% | 5.8% |
| Interquartile 75% (IQ3) | 25.3% | 14.7% |
| Interquartile Range (IQR) | 13.5% | 9.0% |
| Standard Deviation (Sample) | 10.9% | 5.7% |
| Standard Deviation (Population) | 10.5% | 5.7% |
Similar Demographics by Child Poverty Among Girls Under 16
Demographics Similar to Immigrants from West Indies by Child Poverty Among Girls Under 16
In terms of child poverty among girls under 16, the demographic groups most similar to Immigrants from West Indies are Inupiat (20.8%, a difference of 0.070%), Immigrants from Caribbean (20.7%, a difference of 0.27%), Immigrants from Senegal (20.7%, a difference of 0.31%), Immigrants from Grenada (20.7%, a difference of 0.42%), and Immigrants from Latin America (20.6%, a difference of 0.46%).
| Demographics | Rating | Rank | Child Poverty Among Girls Under 16 |
| Immigrants | Belize | 0.0 /100 | #289 | Tragic 20.6% |
| Immigrants | Haiti | 0.0 /100 | #290 | Tragic 20.6% |
| Chippewa | 0.0 /100 | #291 | Tragic 20.6% |
| Immigrants | Latin America | 0.0 /100 | #292 | Tragic 20.6% |
| Immigrants | Grenada | 0.0 /100 | #293 | Tragic 20.7% |
| Immigrants | Senegal | 0.0 /100 | #294 | Tragic 20.7% |
| Immigrants | Caribbean | 0.0 /100 | #295 | Tragic 20.7% |
| Immigrants | West Indies | 0.0 /100 | #296 | Tragic 20.7% |
| Inupiat | 0.0 /100 | #297 | Tragic 20.8% |
| Mexicans | 0.0 /100 | #298 | Tragic 20.9% |
| Hispanics or Latinos | 0.0 /100 | #299 | Tragic 21.0% |
| Somalis | 0.0 /100 | #300 | Tragic 21.0% |
| Choctaw | 0.0 /100 | #301 | Tragic 21.1% |
| Seminole | 0.0 /100 | #302 | Tragic 21.2% |
| British West Indians | 0.0 /100 | #303 | Tragic 21.3% |
Demographics Similar to Albanians by Child Poverty Among Girls Under 16
In terms of child poverty among girls under 16, the demographic groups most similar to Albanians are Immigrants from South Eastern Asia (15.4%, a difference of 0.010%), Immigrants from Norway (15.4%, a difference of 0.090%), Scottish (15.4%, a difference of 0.16%), Puget Sound Salish (15.4%, a difference of 0.17%), and Immigrants from Western Europe (15.4%, a difference of 0.19%).
| Demographics | Rating | Rank | Child Poverty Among Girls Under 16 |
| English | 92.2 /100 | #121 | Exceptional 15.3% |
| Portuguese | 91.8 /100 | #122 | Exceptional 15.3% |
| Irish | 91.5 /100 | #123 | Exceptional 15.3% |
| Carpatho Rusyns | 91.4 /100 | #124 | Exceptional 15.3% |
| Peruvians | 91.2 /100 | #125 | Exceptional 15.4% |
| Scottish | 91.0 /100 | #126 | Exceptional 15.4% |
| Immigrants | Norway | 90.8 /100 | #127 | Exceptional 15.4% |
| Albanians | 90.5 /100 | #128 | Exceptional 15.4% |
| Immigrants | South Eastern Asia | 90.5 /100 | #129 | Exceptional 15.4% |
| Puget Sound Salish | 90.1 /100 | #130 | Exceptional 15.4% |
| Immigrants | Western Europe | 90.0 /100 | #131 | Exceptional 15.4% |
| Mongolians | 89.7 /100 | #132 | Excellent 15.4% |
| Brazilians | 89.6 /100 | #133 | Excellent 15.4% |
| Immigrants | Spain | 89.1 /100 | #134 | Excellent 15.5% |
| Czechoslovakians | 89.0 /100 | #135 | Excellent 15.5% |