Immigrants from Vietnam vs Scotch-Irish Female Poverty
COMPARE
Immigrants from Vietnam
Scotch-Irish
Female Poverty
Female Poverty Comparison
Immigrants from Vietnam
Scotch-Irish
12.8%
FEMALE POVERTY
87.1/ 100
METRIC RATING
130th/ 347
METRIC RANK
13.3%
FEMALE POVERTY
62.1/ 100
METRIC RATING
165th/ 347
METRIC RANK
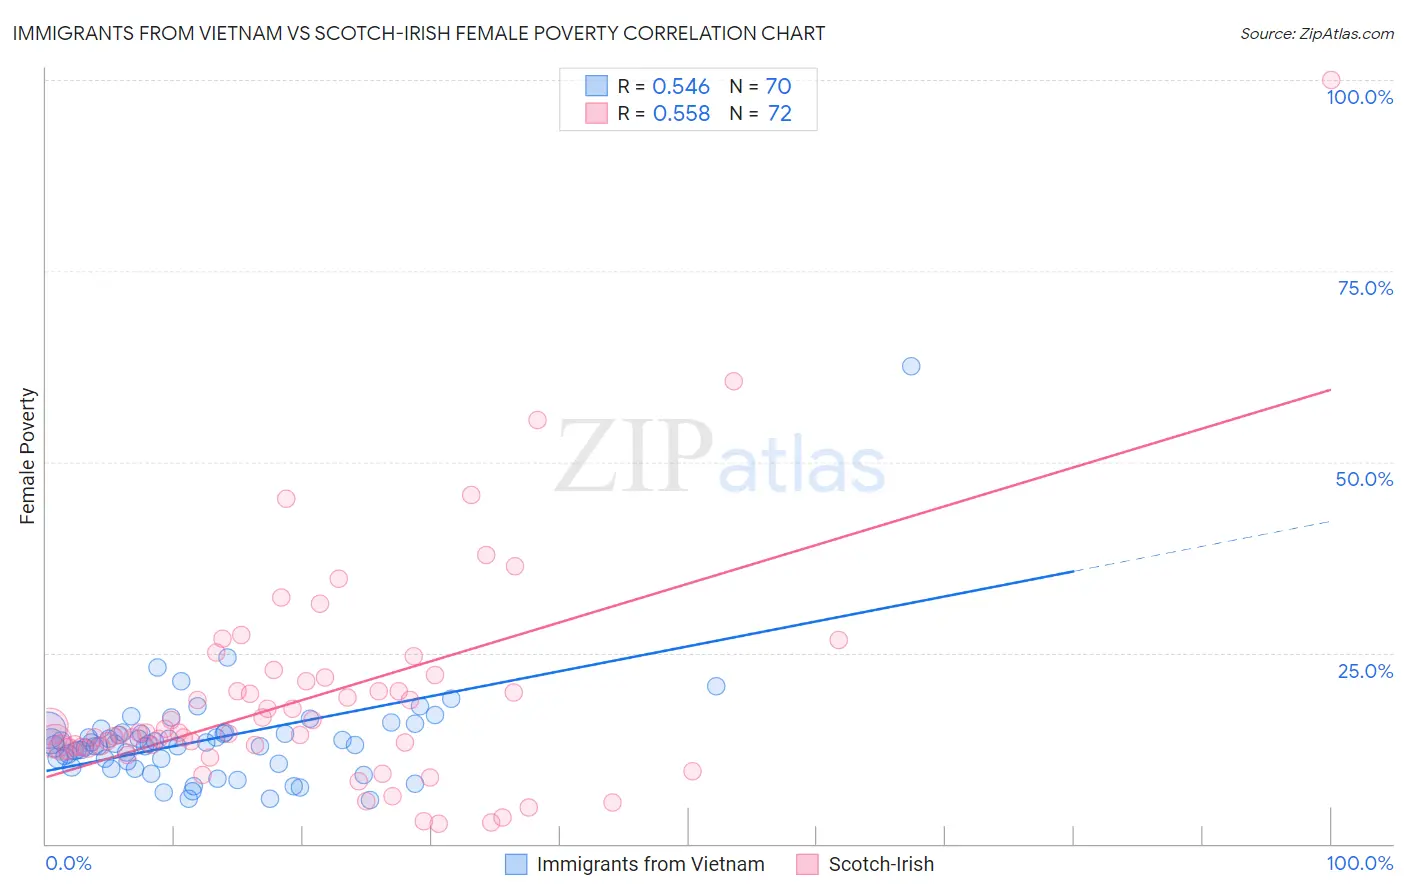
Immigrants from Vietnam vs Scotch-Irish Female Poverty Correlation Chart
The statistical analysis conducted on geographies consisting of 404,524,088 people shows a substantial positive correlation between the proportion of Immigrants from Vietnam and poverty level among females in the United States with a correlation coefficient (R) of 0.546 and weighted average of 12.8%. Similarly, the statistical analysis conducted on geographies consisting of 547,935,242 people shows a substantial positive correlation between the proportion of Scotch-Irish and poverty level among females in the United States with a correlation coefficient (R) of 0.558 and weighted average of 13.3%, a difference of 3.6%.
Female Poverty Correlation Summary
| Measurement | Immigrants from Vietnam | Scotch-Irish |
| Minimum | 5.8% | 2.6% |
| Maximum | 62.5% | 100.0% |
| Range | 56.7% | 97.4% |
| Mean | 13.6% | 19.2% |
| Median | 13.0% | 14.6% |
| Interquartile 25% (IQ1) | 10.8% | 12.6% |
| Interquartile 75% (IQ3) | 14.6% | 21.5% |
| Interquartile Range (IQR) | 3.8% | 8.8% |
| Standard Deviation (Sample) | 7.1% | 14.9% |
| Standard Deviation (Population) | 7.0% | 14.8% |
Similar Demographics by Female Poverty
Demographics Similar to Immigrants from Vietnam by Female Poverty
In terms of female poverty, the demographic groups most similar to Immigrants from Vietnam are Immigrants from Argentina (12.8%, a difference of 0.030%), Immigrants from Jordan (12.8%, a difference of 0.050%), Immigrants from Western Europe (12.8%, a difference of 0.11%), Immigrants from Brazil (12.8%, a difference of 0.19%), and Immigrants from Belarus (12.8%, a difference of 0.27%).
| Demographics | Rating | Rank | Female Poverty |
| Immigrants | South Eastern Asia | 89.9 /100 | #123 | Excellent 12.7% |
| Immigrants | Norway | 89.3 /100 | #124 | Excellent 12.8% |
| Argentineans | 89.1 /100 | #125 | Excellent 12.8% |
| Immigrants | Ukraine | 88.8 /100 | #126 | Excellent 12.8% |
| South Africans | 88.4 /100 | #127 | Excellent 12.8% |
| Immigrants | Belarus | 88.2 /100 | #128 | Excellent 12.8% |
| Immigrants | Brazil | 87.9 /100 | #129 | Excellent 12.8% |
| Immigrants | Vietnam | 87.1 /100 | #130 | Excellent 12.8% |
| Immigrants | Argentina | 87.0 /100 | #131 | Excellent 12.8% |
| Immigrants | Jordan | 86.9 /100 | #132 | Excellent 12.8% |
| Immigrants | Western Europe | 86.6 /100 | #133 | Excellent 12.8% |
| Immigrants | Switzerland | 85.8 /100 | #134 | Excellent 12.9% |
| French | 85.6 /100 | #135 | Excellent 12.9% |
| Peruvians | 85.2 /100 | #136 | Excellent 12.9% |
| Chileans | 84.7 /100 | #137 | Excellent 12.9% |
Demographics Similar to Scotch-Irish by Female Poverty
In terms of female poverty, the demographic groups most similar to Scotch-Irish are Ethiopian (13.3%, a difference of 0.020%), Guamanian/Chamorro (13.3%, a difference of 0.030%), Immigrants from Albania (13.3%, a difference of 0.030%), Immigrants from Ethiopia (13.3%, a difference of 0.040%), and Immigrants from Nepal (13.3%, a difference of 0.070%).
| Demographics | Rating | Rank | Female Poverty |
| Pennsylvania Germans | 67.3 /100 | #158 | Good 13.2% |
| Costa Ricans | 63.6 /100 | #159 | Good 13.3% |
| Immigrants | Nepal | 62.7 /100 | #160 | Good 13.3% |
| Immigrants | Ethiopia | 62.5 /100 | #161 | Good 13.3% |
| Guamanians/Chamorros | 62.4 /100 | #162 | Good 13.3% |
| Immigrants | Albania | 62.4 /100 | #163 | Good 13.3% |
| Ethiopians | 62.3 /100 | #164 | Good 13.3% |
| Scotch-Irish | 62.1 /100 | #165 | Good 13.3% |
| Immigrants | Oceania | 59.7 /100 | #166 | Average 13.3% |
| Immigrants | Chile | 57.4 /100 | #167 | Average 13.3% |
| Aleuts | 56.7 /100 | #168 | Average 13.4% |
| Lebanese | 55.9 /100 | #169 | Average 13.4% |
| Colombians | 55.7 /100 | #170 | Average 13.4% |
| Whites/Caucasians | 54.6 /100 | #171 | Average 13.4% |
| Mongolians | 53.6 /100 | #172 | Average 13.4% |