Immigrants from Venezuela vs Vietnamese Female Poverty
COMPARE
Immigrants from Venezuela
Vietnamese
Female Poverty
Female Poverty Comparison
Immigrants from Venezuela
Vietnamese
13.6%
FEMALE POVERTY
41.0/ 100
METRIC RATING
187th/ 347
METRIC RANK
16.1%
FEMALE POVERTY
0.0/ 100
METRIC RATING
280th/ 347
METRIC RANK
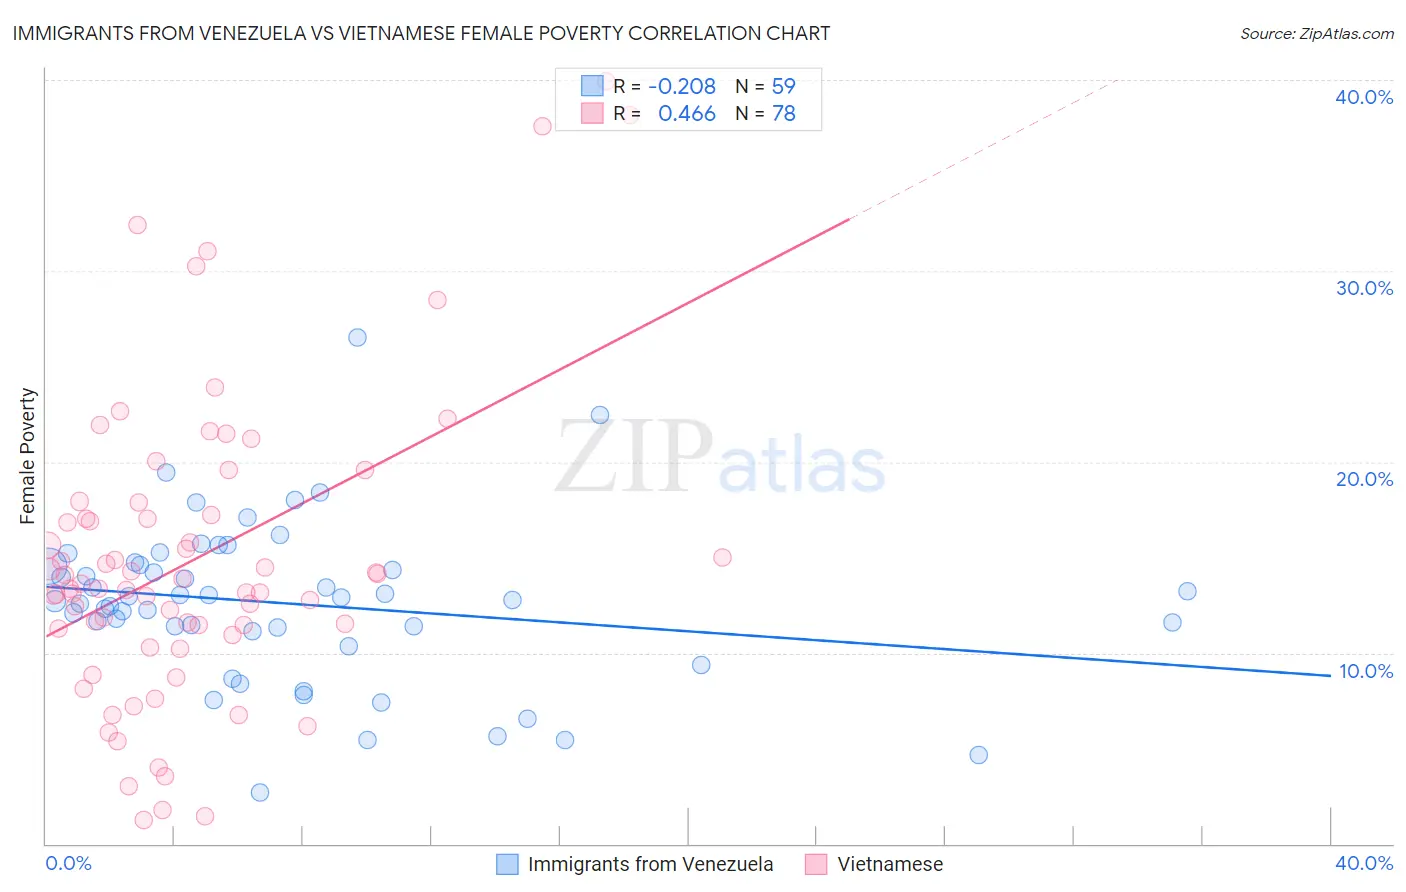
Immigrants from Venezuela vs Vietnamese Female Poverty Correlation Chart
The statistical analysis conducted on geographies consisting of 287,717,051 people shows a weak negative correlation between the proportion of Immigrants from Venezuela and poverty level among females in the United States with a correlation coefficient (R) of -0.208 and weighted average of 13.6%. Similarly, the statistical analysis conducted on geographies consisting of 170,651,264 people shows a moderate positive correlation between the proportion of Vietnamese and poverty level among females in the United States with a correlation coefficient (R) of 0.466 and weighted average of 16.1%, a difference of 18.8%.
Female Poverty Correlation Summary
| Measurement | Immigrants from Venezuela | Vietnamese |
| Minimum | 2.7% | 1.2% |
| Maximum | 26.5% | 39.9% |
| Range | 23.8% | 38.7% |
| Mean | 12.6% | 14.9% |
| Median | 12.8% | 13.5% |
| Interquartile 25% (IQ1) | 11.2% | 11.2% |
| Interquartile 75% (IQ3) | 14.6% | 17.2% |
| Interquartile Range (IQR) | 3.5% | 6.0% |
| Standard Deviation (Sample) | 4.2% | 8.0% |
| Standard Deviation (Population) | 4.2% | 7.9% |
Similar Demographics by Female Poverty
Demographics Similar to Immigrants from Venezuela by Female Poverty
In terms of female poverty, the demographic groups most similar to Immigrants from Venezuela are Immigrants from Portugal (13.6%, a difference of 0.050%), Immigrants from Cameroon (13.5%, a difference of 0.11%), Hawaiian (13.6%, a difference of 0.11%), Uruguayan (13.6%, a difference of 0.11%), and Immigrants from Sierra Leone (13.5%, a difference of 0.22%).
| Demographics | Rating | Rank | Female Poverty |
| South Americans | 44.8 /100 | #180 | Average 13.5% |
| Venezuelans | 44.5 /100 | #181 | Average 13.5% |
| Immigrants | Colombia | 44.5 /100 | #182 | Average 13.5% |
| Kenyans | 43.8 /100 | #183 | Average 13.5% |
| Immigrants | Sierra Leone | 43.2 /100 | #184 | Average 13.5% |
| Immigrants | Cameroon | 42.0 /100 | #185 | Average 13.5% |
| Immigrants | Portugal | 41.5 /100 | #186 | Average 13.6% |
| Immigrants | Venezuela | 41.0 /100 | #187 | Average 13.6% |
| Hawaiians | 39.9 /100 | #188 | Fair 13.6% |
| Uruguayans | 39.8 /100 | #189 | Fair 13.6% |
| Sierra Leoneans | 33.1 /100 | #190 | Fair 13.7% |
| Immigrants | Kuwait | 32.7 /100 | #191 | Fair 13.7% |
| Immigrants | Costa Rica | 31.9 /100 | #192 | Fair 13.7% |
| Iraqis | 31.8 /100 | #193 | Fair 13.7% |
| Delaware | 31.1 /100 | #194 | Fair 13.7% |
Demographics Similar to Vietnamese by Female Poverty
In terms of female poverty, the demographic groups most similar to Vietnamese are West Indian (16.1%, a difference of 0.020%), Immigrants from Haiti (16.1%, a difference of 0.17%), Immigrants from Bahamas (16.1%, a difference of 0.24%), Immigrants from Cuba (16.1%, a difference of 0.26%), and Spanish American (16.2%, a difference of 0.31%).
| Demographics | Rating | Rank | Female Poverty |
| Haitians | 0.0 /100 | #273 | Tragic 15.9% |
| Barbadians | 0.0 /100 | #274 | Tragic 15.9% |
| Immigrants | Barbados | 0.0 /100 | #275 | Tragic 16.0% |
| Central Americans | 0.0 /100 | #276 | Tragic 16.0% |
| Bangladeshis | 0.0 /100 | #277 | Tragic 16.0% |
| Immigrants | West Indies | 0.0 /100 | #278 | Tragic 16.1% |
| Immigrants | Bahamas | 0.0 /100 | #279 | Tragic 16.1% |
| Vietnamese | 0.0 /100 | #280 | Tragic 16.1% |
| West Indians | 0.0 /100 | #281 | Tragic 16.1% |
| Immigrants | Haiti | 0.0 /100 | #282 | Tragic 16.1% |
| Immigrants | Cuba | 0.0 /100 | #283 | Tragic 16.1% |
| Spanish Americans | 0.0 /100 | #284 | Tragic 16.2% |
| Comanche | 0.0 /100 | #285 | Tragic 16.2% |
| Inupiat | 0.0 /100 | #286 | Tragic 16.2% |
| Immigrants | Belize | 0.0 /100 | #287 | Tragic 16.3% |