Immigrants from Venezuela vs Vietnamese Family Poverty
COMPARE
Immigrants from Venezuela
Vietnamese
Family Poverty
Family Poverty Comparison
Immigrants from Venezuela
Vietnamese
9.3%
FAMILY POVERTY
26.1/ 100
METRIC RATING
196th/ 347
METRIC RANK
11.5%
FAMILY POVERTY
0.0/ 100
METRIC RATING
287th/ 347
METRIC RANK
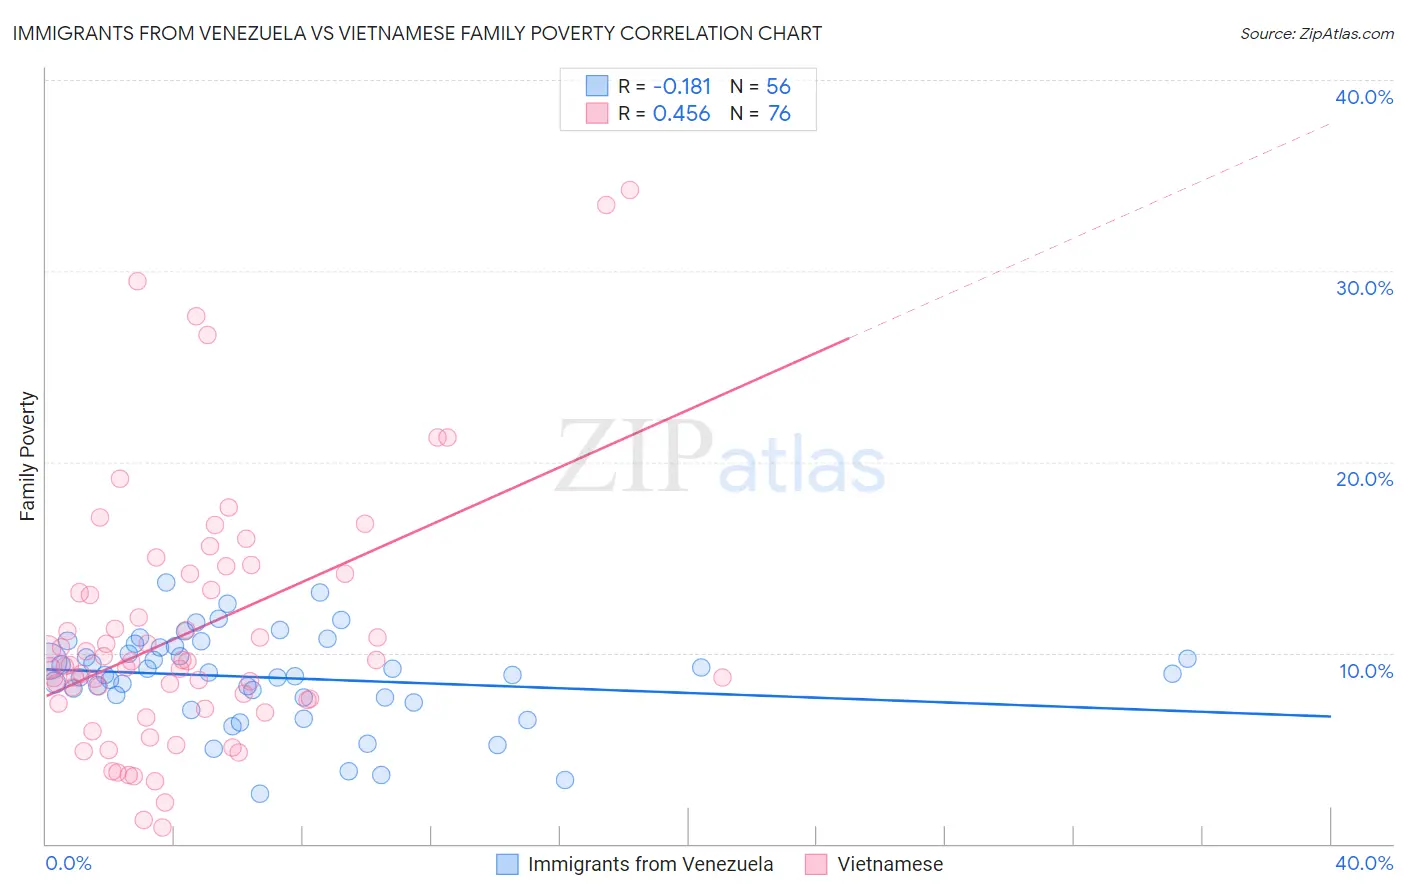
Immigrants from Venezuela vs Vietnamese Family Poverty Correlation Chart
The statistical analysis conducted on geographies consisting of 287,460,652 people shows a poor negative correlation between the proportion of Immigrants from Venezuela and poverty level among families in the United States with a correlation coefficient (R) of -0.181 and weighted average of 9.3%. Similarly, the statistical analysis conducted on geographies consisting of 170,550,296 people shows a moderate positive correlation between the proportion of Vietnamese and poverty level among families in the United States with a correlation coefficient (R) of 0.456 and weighted average of 11.5%, a difference of 23.4%.
Family Poverty Correlation Summary
| Measurement | Immigrants from Venezuela | Vietnamese |
| Minimum | 2.6% | 0.88% |
| Maximum | 13.7% | 34.2% |
| Range | 11.1% | 33.4% |
| Mean | 8.7% | 11.1% |
| Median | 8.9% | 9.4% |
| Interquartile 25% (IQ1) | 7.7% | 7.4% |
| Interquartile 75% (IQ3) | 10.3% | 13.7% |
| Interquartile Range (IQR) | 2.7% | 6.3% |
| Standard Deviation (Sample) | 2.4% | 6.8% |
| Standard Deviation (Population) | 2.4% | 6.7% |
Similar Demographics by Family Poverty
Demographics Similar to Immigrants from Venezuela by Family Poverty
In terms of family poverty, the demographic groups most similar to Immigrants from Venezuela are Venezuelan (9.3%, a difference of 0.21%), Immigrants from Colombia (9.3%, a difference of 0.29%), Iraqi (9.3%, a difference of 0.32%), South American (9.3%, a difference of 0.33%), and Immigrants from Western Asia (9.3%, a difference of 0.34%).
| Demographics | Rating | Rank | Family Poverty |
| Immigrants | Afghanistan | 32.1 /100 | #189 | Fair 9.2% |
| Arabs | 31.5 /100 | #190 | Fair 9.2% |
| Ugandans | 28.7 /100 | #191 | Fair 9.3% |
| Spanish | 28.7 /100 | #192 | Fair 9.3% |
| Immigrants | Western Asia | 28.2 /100 | #193 | Fair 9.3% |
| South Americans | 28.1 /100 | #194 | Fair 9.3% |
| Venezuelans | 27.4 /100 | #195 | Fair 9.3% |
| Immigrants | Venezuela | 26.1 /100 | #196 | Fair 9.3% |
| Immigrants | Colombia | 24.4 /100 | #197 | Fair 9.3% |
| Iraqis | 24.2 /100 | #198 | Fair 9.3% |
| Spaniards | 22.8 /100 | #199 | Fair 9.4% |
| Immigrants | Costa Rica | 21.7 /100 | #200 | Fair 9.4% |
| Immigrants | Portugal | 20.5 /100 | #201 | Fair 9.4% |
| Immigrants | Sierra Leone | 19.6 /100 | #202 | Poor 9.4% |
| German Russians | 19.4 /100 | #203 | Poor 9.4% |
Demographics Similar to Vietnamese by Family Poverty
In terms of family poverty, the demographic groups most similar to Vietnamese are Immigrants from Belize (11.5%, a difference of 0.19%), Immigrants from Barbados (11.5%, a difference of 0.24%), West Indian (11.5%, a difference of 0.25%), Senegalese (11.5%, a difference of 0.27%), and Haitian (11.5%, a difference of 0.31%).
| Demographics | Rating | Rank | Family Poverty |
| Belizeans | 0.0 /100 | #280 | Tragic 11.3% |
| Immigrants | West Indies | 0.0 /100 | #281 | Tragic 11.3% |
| Immigrants | Cuba | 0.0 /100 | #282 | Tragic 11.3% |
| Indonesians | 0.0 /100 | #283 | Tragic 11.3% |
| Yaqui | 0.0 /100 | #284 | Tragic 11.3% |
| Barbadians | 0.0 /100 | #285 | Tragic 11.3% |
| Senegalese | 0.0 /100 | #286 | Tragic 11.5% |
| Vietnamese | 0.0 /100 | #287 | Tragic 11.5% |
| Immigrants | Belize | 0.0 /100 | #288 | Tragic 11.5% |
| Immigrants | Barbados | 0.0 /100 | #289 | Tragic 11.5% |
| West Indians | 0.0 /100 | #290 | Tragic 11.5% |
| Haitians | 0.0 /100 | #291 | Tragic 11.5% |
| Immigrants | Somalia | 0.0 /100 | #292 | Tragic 11.5% |
| Immigrants | Cabo Verde | 0.0 /100 | #293 | Tragic 11.6% |
| Immigrants | St. Vincent and the Grenadines | 0.0 /100 | #294 | Tragic 11.6% |