Immigrants from Venezuela vs Ukrainian Seniors Poverty Over the Age of 65
COMPARE
Immigrants from Venezuela
Ukrainian
Seniors Poverty Over the Age of 65
Seniors Poverty Over the Age of 65 Comparison
Immigrants from Venezuela
Ukrainians
12.7%
SENIORS POVERTY OVER THE AGE OF 65
0.1/ 100
METRIC RATING
269th/ 347
METRIC RANK
10.1%
SENIORS POVERTY OVER THE AGE OF 65
96.9/ 100
METRIC RATING
90th/ 347
METRIC RANK
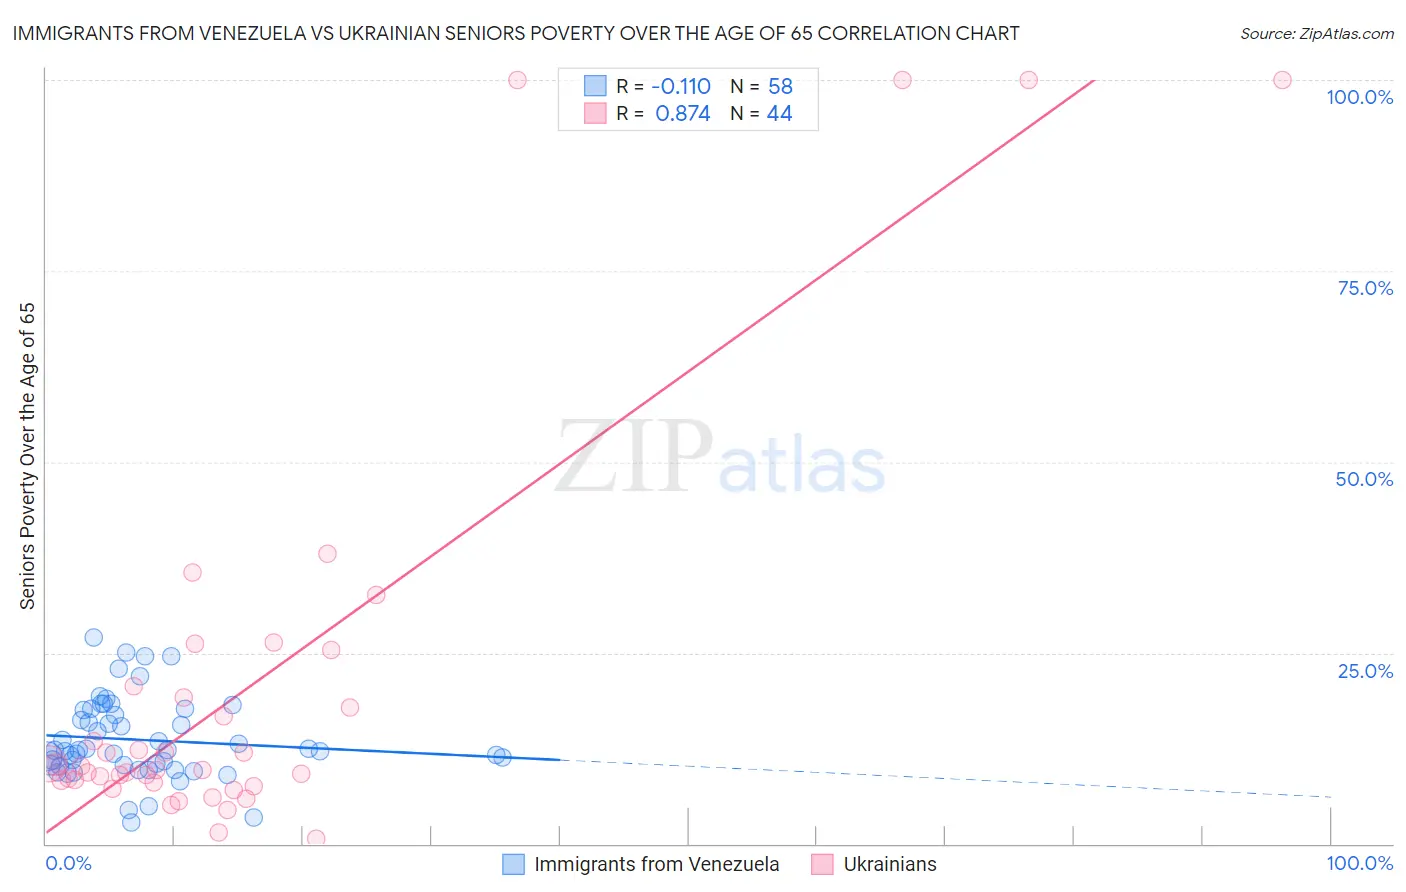
Immigrants from Venezuela vs Ukrainian Seniors Poverty Over the Age of 65 Correlation Chart
The statistical analysis conducted on geographies consisting of 287,189,171 people shows a poor negative correlation between the proportion of Immigrants from Venezuela and poverty level among seniors over the age of 65 in the United States with a correlation coefficient (R) of -0.110 and weighted average of 12.7%. Similarly, the statistical analysis conducted on geographies consisting of 446,354,944 people shows a very strong positive correlation between the proportion of Ukrainians and poverty level among seniors over the age of 65 in the United States with a correlation coefficient (R) of 0.874 and weighted average of 10.1%, a difference of 25.8%.
Seniors Poverty Over the Age of 65 Correlation Summary
| Measurement | Immigrants from Venezuela | Ukrainian |
| Minimum | 2.8% | 0.61% |
| Maximum | 27.0% | 100.0% |
| Range | 24.3% | 99.4% |
| Mean | 13.6% | 20.7% |
| Median | 12.2% | 9.9% |
| Interquartile 25% (IQ1) | 10.2% | 8.2% |
| Interquartile 75% (IQ3) | 17.4% | 19.9% |
| Interquartile Range (IQR) | 7.2% | 11.7% |
| Standard Deviation (Sample) | 5.3% | 26.7% |
| Standard Deviation (Population) | 5.2% | 26.4% |
Similar Demographics by Seniors Poverty Over the Age of 65
Demographics Similar to Immigrants from Venezuela by Seniors Poverty Over the Age of 65
In terms of seniors poverty over the age of 65, the demographic groups most similar to Immigrants from Venezuela are Immigrants from South America (12.7%, a difference of 0.24%), Immigrants from Ghana (12.8%, a difference of 0.52%), Immigrants from Uruguay (12.8%, a difference of 0.55%), Immigrants from Somalia (12.6%, a difference of 0.60%), and Kiowa (12.8%, a difference of 0.67%).
| Demographics | Rating | Rank | Seniors Poverty Over the Age of 65 |
| Venezuelans | 0.1 /100 | #262 | Tragic 12.5% |
| Soviet Union | 0.1 /100 | #263 | Tragic 12.6% |
| Inupiat | 0.1 /100 | #264 | Tragic 12.6% |
| Immigrants | Western Africa | 0.1 /100 | #265 | Tragic 12.6% |
| Africans | 0.1 /100 | #266 | Tragic 12.6% |
| Blackfeet | 0.1 /100 | #267 | Tragic 12.6% |
| Immigrants | Somalia | 0.1 /100 | #268 | Tragic 12.6% |
| Immigrants | Venezuela | 0.1 /100 | #269 | Tragic 12.7% |
| Immigrants | South America | 0.1 /100 | #270 | Tragic 12.7% |
| Immigrants | Ghana | 0.1 /100 | #271 | Tragic 12.8% |
| Immigrants | Uruguay | 0.1 /100 | #272 | Tragic 12.8% |
| Kiowa | 0.0 /100 | #273 | Tragic 12.8% |
| Salvadorans | 0.0 /100 | #274 | Tragic 12.8% |
| Immigrants | Colombia | 0.0 /100 | #275 | Tragic 12.9% |
| Immigrants | Azores | 0.0 /100 | #276 | Tragic 12.9% |
Demographics Similar to Ukrainians by Seniors Poverty Over the Age of 65
In terms of seniors poverty over the age of 65, the demographic groups most similar to Ukrainians are Puget Sound Salish (10.1%, a difference of 0.020%), Immigrants from Singapore (10.1%, a difference of 0.040%), Immigrants from Bulgaria (10.1%, a difference of 0.060%), Jordanian (10.1%, a difference of 0.14%), and Immigrants from Sweden (10.1%, a difference of 0.15%).
| Demographics | Rating | Rank | Seniors Poverty Over the Age of 65 |
| Immigrants | Poland | 97.2 /100 | #83 | Exceptional 10.1% |
| Immigrants | Afghanistan | 97.2 /100 | #84 | Exceptional 10.1% |
| Immigrants | Nepal | 97.2 /100 | #85 | Exceptional 10.1% |
| Romanians | 97.2 /100 | #86 | Exceptional 10.1% |
| Burmese | 97.2 /100 | #87 | Exceptional 10.1% |
| Jordanians | 97.1 /100 | #88 | Exceptional 10.1% |
| Immigrants | Bulgaria | 97.0 /100 | #89 | Exceptional 10.1% |
| Ukrainians | 96.9 /100 | #90 | Exceptional 10.1% |
| Puget Sound Salish | 96.9 /100 | #91 | Exceptional 10.1% |
| Immigrants | Singapore | 96.9 /100 | #92 | Exceptional 10.1% |
| Immigrants | Sweden | 96.7 /100 | #93 | Exceptional 10.1% |
| Immigrants | Germany | 96.7 /100 | #94 | Exceptional 10.1% |
| Immigrants | Japan | 96.3 /100 | #95 | Exceptional 10.1% |
| Basques | 95.9 /100 | #96 | Exceptional 10.2% |
| Immigrants | Pakistan | 95.7 /100 | #97 | Exceptional 10.2% |