Immigrants from Honduras vs Ukrainian Seniors Poverty Over the Age of 65

COMPARE

Immigrants from Honduras
Race
Ancestry
AfghanAfricanAlaska NativeAlaskan AthabascanAlbanianAleutAlsatianAmericanApacheArabArapahoArgentineanArmenianAssyrian/Chaldean/SyriacAustralianAustrianBahamianBangladeshiBarbadianBasqueBelgianBelizeanBermudanBhutaneseBlackfeetBolivianBrazilianBritishBritish West IndianBulgarianBurmeseCajunCambodianCanadianCape VerdeanCarpatho RusynCelticCentral AmericanCentral American IndianCherokeeCheyenneChickasawChileanChineseChippewaChoctawColombianColvilleComancheCosta RicanCreeCreekCroatianCrowCubanCypriotCzechCzechoslovakianDanishDelawareDominicanDutchDutch West IndianEastern EuropeanEcuadorianEgyptianEnglishEstonianEthiopianEuropeanFijianFilipinoFinnishFrenchFrench American IndianFrench CanadianGermanGerman RussianGhanaianGreekGuamanian/ChamorroGuatemalanGuyaneseHaitianHmongHonduranHopiHoumaHungarianIcelanderIndian (Asian)IndonesianInupiatIranianIraqiIrishIroquoisIsraeliItalianJamaicanJapaneseJordanianKenyanKiowaKoreanLaotianLatvianLebaneseLiberianLithuanianLumbeeLuxembourgerMacedonianMalaysianMalteseMarshalleseMenomineeMexicanMexican American IndianMongolianMoroccanNative HawaiianNavajoNepaleseNew ZealanderNicaraguanNigerianNorthern EuropeanNorwegianOkinawanOsageOttawaPaiutePakistaniPalestinianPanamanianParaguayanPennsylvania GermanPeruvianPimaPolishPortuguesePotawatomiPuebloPuerto RicanPuget Sound SalishRomanianRussianSalvadoranSamoanScandinavianScotch-IrishScottishSeminoleSenegaleseSerbianShoshoneSierra LeoneanSiouxSlavicSlovakSloveneSomaliSouth AfricanSouth AmericanSouth American IndianSoviet UnionSpaniardSpanishSpanish AmericanSpanish American IndianSri LankanSubsaharan AfricanSudaneseSwedishSwissSyrianTaiwaneseThaiTlingit-HaidaTohono O'OdhamTonganTrinidadian and TobagonianTsimshianTurkishU.S. Virgin IslanderUgandanUruguayanUteVenezuelanVietnameseWelshWest IndianYakamaYaquiYugoslavianYumanYup'ikZimbabwean
Immigration
NonimmigrantsImmigrantsAfghanistanAfricaAlbaniaArgentinaArmeniaAsiaAustraliaAustriaBahamasBangladeshBarbadosBelarusBelgiumBelizeBoliviaBosnia and HerzegovinaBrazilBulgariaBurma/MyanmarCabo VerdeCambodiaCameroonCanadaCaribbeanCentral AmericaChileChinaColombiaCongoCosta RicaCroatiaCubaCzechoslovakiaDenmarkDominicaDominican RepublicEastern AfricaEastern AsiaEastern EuropeEcuadorEgyptEl SalvadorEnglandEritreaEthiopiaEuropeFijiFranceGermanyGhanaGreeceGrenadaGuatemalaGuyanaHaitiHondurasHong KongHungaryIndiaIndonesiaIranIraqIrelandIsraelItalyJamaicaJapanJordanKazakhstanKenyaKoreaKuwaitLaosLatin AmericaLatviaLebanonLiberiaLithuaniaMalaysiaMexicoMicronesiaMiddle AfricaMoldovaMoroccoNepalNetherlandsNicaraguaNigeriaNorth AmericaNorth MacedoniaNorthern AfricaNorthern EuropeNorwayOceaniaPakistanPanamaPeruPhilippinesPolandPortugalRomaniaRussiaSaudi ArabiaScotlandSenegalSerbiaSierra LeoneSingaporeSomaliaSouth AfricaSouth AmericaSouth Central AsiaSouth Eastern AsiaSouthern EuropeSpainSri LankaSt. Vincent and the GrenadinesSudanSwedenSwitzerlandSyriaTaiwanThailandTrinidad and TobagoTurkeyUgandaUkraineUruguayUzbekistanVenezuelaVietnamWest IndiesWestern AfricaWestern AsiaWestern EuropeYemenZaireZimbabweAzores
Ukrainian
Race
Ancestry
AfghanAfricanAlaska NativeAlaskan AthabascanAlbanianAleutAlsatianAmericanApacheArabArapahoArgentineanArmenianAssyrian/Chaldean/SyriacAustralianAustrianBahamianBangladeshiBarbadianBasqueBelgianBelizeanBermudanBhutaneseBlackfeetBolivianBrazilianBritishBritish West IndianBulgarianBurmeseCajunCambodianCanadianCape VerdeanCarpatho RusynCelticCentral AmericanCentral American IndianCherokeeCheyenneChickasawChileanChineseChippewaChoctawColombianColvilleComancheCosta RicanCreeCreekCroatianCrowCubanCypriotCzechCzechoslovakianDanishDelawareDominicanDutchDutch West IndianEastern EuropeanEcuadorianEgyptianEnglishEstonianEthiopianEuropeanFijianFilipinoFinnishFrenchFrench American IndianFrench CanadianGermanGerman RussianGhanaianGreekGuamanian/ChamorroGuatemalanGuyaneseHaitianHmongHonduranHopiHoumaHungarianIcelanderIndian (Asian)IndonesianInupiatIranianIraqiIrishIroquoisIsraeliItalianJamaicanJapaneseJordanianKenyanKiowaKoreanLaotianLatvianLebaneseLiberianLithuanianLumbeeLuxembourgerMacedonianMalaysianMalteseMarshalleseMenomineeMexicanMexican American IndianMongolianMoroccanNative HawaiianNavajoNepaleseNew ZealanderNicaraguanNigerianNorthern EuropeanNorwegianOkinawanOsageOttawaPaiutePakistaniPalestinianPanamanianParaguayanPennsylvania GermanPeruvianPimaPolishPortuguesePotawatomiPuebloPuerto RicanPuget Sound SalishRomanianRussianSalvadoranSamoanScandinavianScotch-IrishScottishSeminoleSenegaleseSerbianShoshoneSierra LeoneanSiouxSlavicSlovakSloveneSomaliSouth AfricanSouth AmericanSouth American IndianSoviet UnionSpaniardSpanishSpanish AmericanSpanish American IndianSri LankanSubsaharan AfricanSudaneseSwedishSwissSyrianTaiwaneseThaiTlingit-HaidaTohono O'OdhamTonganTrinidadian and TobagonianTsimshianTurkishU.S. Virgin IslanderUgandanUkrainianUruguayanUteVenezuelanVietnameseWelshWest IndianYakamaYaquiYugoslavianYumanYup'ikZimbabwean
Immigration
NonimmigrantsImmigrantsAfghanistanAfricaAlbaniaArgentinaArmeniaAsiaAustraliaAustriaBahamasBangladeshBarbadosBelarusBelgiumBelizeBoliviaBosnia and HerzegovinaBrazilBulgariaBurma/MyanmarCabo VerdeCambodiaCameroonCanadaCaribbeanCentral AmericaChileChinaColombiaCongoCosta RicaCroatiaCubaCzechoslovakiaDenmarkDominicaDominican RepublicEastern AfricaEastern AsiaEastern EuropeEcuadorEgyptEl SalvadorEnglandEritreaEthiopiaEuropeFijiFranceGermanyGhanaGreeceGrenadaGuatemalaGuyanaHaitiHong KongHungaryIndiaIndonesiaIranIraqIrelandIsraelItalyJamaicaJapanJordanKazakhstanKenyaKoreaKuwaitLaosLatin AmericaLatviaLebanonLiberiaLithuaniaMalaysiaMexicoMicronesiaMiddle AfricaMoldovaMoroccoNepalNetherlandsNicaraguaNigeriaNorth AmericaNorth MacedoniaNorthern AfricaNorthern EuropeNorwayOceaniaPakistanPanamaPeruPhilippinesPolandPortugalRomaniaRussiaSaudi ArabiaScotlandSenegalSerbiaSierra LeoneSingaporeSomaliaSouth AfricaSouth AmericaSouth Central AsiaSouth Eastern AsiaSouthern EuropeSpainSri LankaSt. Vincent and the GrenadinesSudanSwedenSwitzerlandSyriaTaiwanThailandTrinidad and TobagoTurkeyUgandaUkraineUruguayUzbekistanVenezuelaVietnamWest IndiesWestern AfricaWestern AsiaWestern EuropeYemenZaireZimbabweAzores
Seniors Poverty Over the Age of 65
Income
Poverty
Unemployment
Labor Participation
Family Structure
Vehicle Availability
Education Level
Disability

Seniors Poverty Over the Age of 65 Comparison

Immigrants from Honduras

Ukrainians

Tragic
Exceptional
14.5%
SENIORS POVERTY OVER THE AGE OF 65
0.0/ 100
METRIC RATING
318th/ 347
METRIC RANK
10.1%
SENIORS POVERTY OVER THE AGE OF 65
96.9/ 100
METRIC RATING
90th/ 347
METRIC RANK

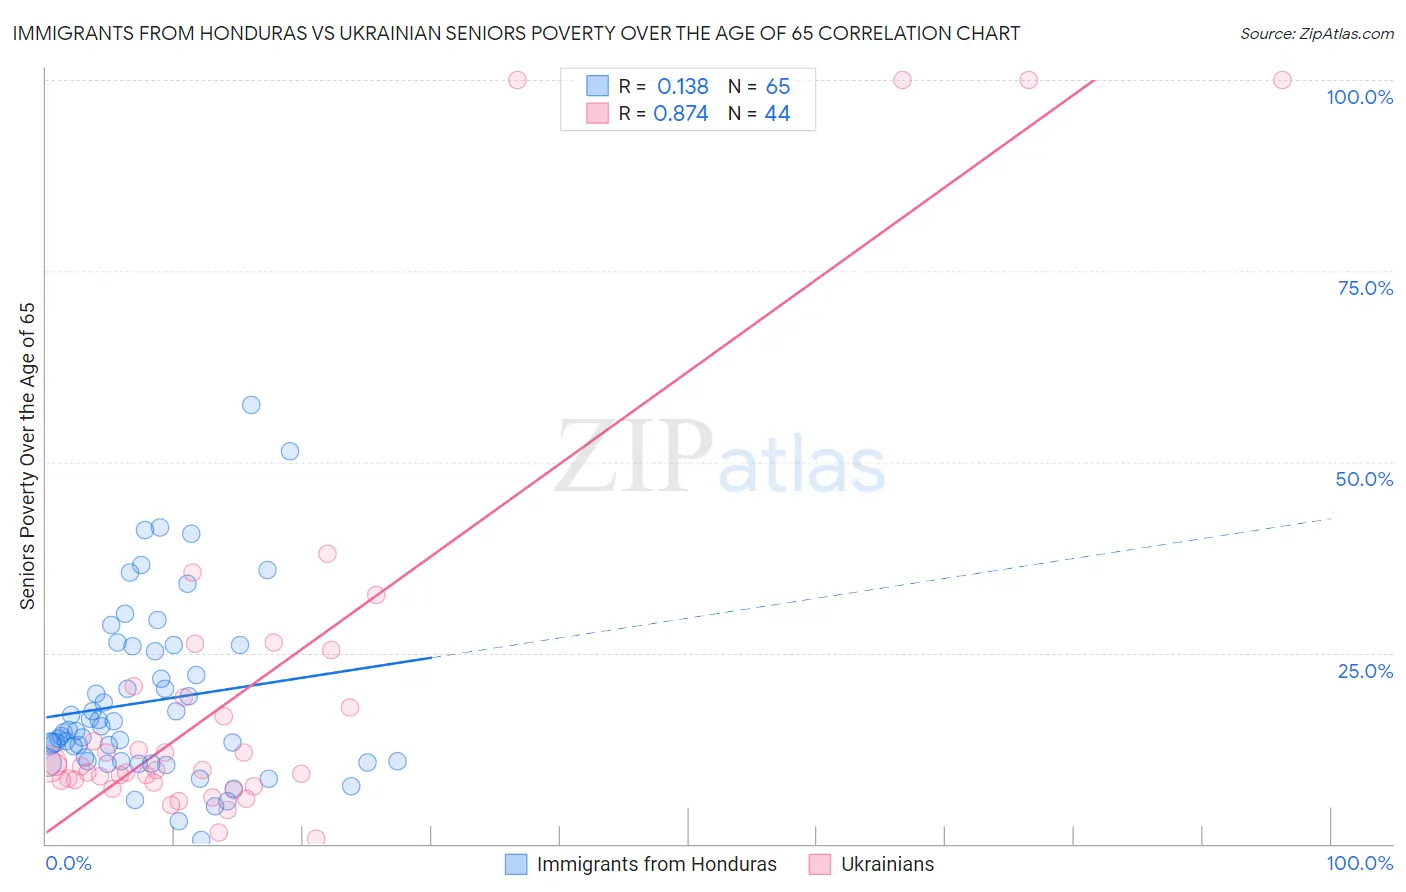
Immigrants from Honduras vs Ukrainian Seniors Poverty Over the Age of 65 Correlation Chart

The statistical analysis conducted on geographies consisting of 322,012,032 people shows a poor positive correlation between the proportion of Immigrants from Honduras and poverty level among seniors over the age of 65 in the United States with a correlation coefficient (R) of 0.138 and weighted average of 14.5%. Similarly, the statistical analysis conducted on geographies consisting of 446,354,944 people shows a very strong positive correlation between the proportion of Ukrainians and poverty level among seniors over the age of 65 in the United States with a correlation coefficient (R) of 0.874 and weighted average of 10.1%, a difference of 43.6%.
Immigrants from Honduras vs Ukrainian Seniors Poverty Over the Age of 65

Seniors Poverty Over the Age of 65 Correlation Summary

MeasurementImmigrants from HondurasUkrainian
Minimum0.43%0.61%
Maximum57.4%100.0%
Range57.0%99.4%
Mean18.6%20.7%
Median14.7%9.9%
Interquartile 25% (IQ1)10.8%8.2%
Interquartile 75% (IQ3)25.5%19.9%
Interquartile Range (IQR)14.7%11.7%
Standard Deviation (Sample)11.5%26.7%
Standard Deviation (Population)11.4%26.4%

Similar Demographics by Seniors Poverty Over the Age of 65

Demographics Similar to Immigrants from Honduras by Seniors Poverty Over the Age of 65

In terms of seniors poverty over the age of 65, the demographic groups most similar to Immigrants from Honduras are Haitian (14.5%, a difference of 0.21%), Immigrants from Guyana (14.5%, a difference of 0.24%), Immigrants from Ecuador (14.4%, a difference of 0.45%), Guyanese (14.4%, a difference of 0.49%), and Barbadian (14.4%, a difference of 0.88%).
DemographicsRating | RankSeniors Poverty Over the Age of 65
Natives/Alaskans
0.0
/100
|
#311
Tragic
14.2%
Hispanics or Latinos
0.0
/100
|
#312
Tragic
14.3%
Barbadians
0.0
/100
|
#313
Tragic
14.4%
Guyanese
0.0
/100
|
#314
Tragic
14.4%
Immigrants | Ecuador
0.0
/100
|
#315
Tragic
14.4%
Immigrants | Guyana
0.0
/100
|
#316
Tragic
14.5%
Haitians
0.0
/100
|
#317
Tragic
14.5%
Immigrants | Honduras
0.0
/100
|
#318
Tragic
14.5%
Cape Verdeans
0.0
/100
|
#319
Tragic
14.7%
Immigrants | Haiti
0.0
/100
|
#320
Tragic
14.7%
Houma
0.0
/100
|
#321
Tragic
14.7%
Immigrants | Barbados
0.0
/100
|
#322
Tragic
14.8%
Yakama
0.0
/100
|
#323
Tragic
14.8%
Nicaraguans
0.0
/100
|
#324
Tragic
15.0%
Central American Indians
0.0
/100
|
#325
Tragic
15.1%

Demographics Similar to Ukrainians by Seniors Poverty Over the Age of 65

In terms of seniors poverty over the age of 65, the demographic groups most similar to Ukrainians are Puget Sound Salish (10.1%, a difference of 0.020%), Immigrants from Singapore (10.1%, a difference of 0.040%), Immigrants from Bulgaria (10.1%, a difference of 0.060%), Jordanian (10.1%, a difference of 0.14%), and Immigrants from Sweden (10.1%, a difference of 0.15%).
DemographicsRating | RankSeniors Poverty Over the Age of 65
Immigrants | Poland
97.2
/100
|
#83
Exceptional
10.1%
Immigrants | Afghanistan
97.2
/100
|
#84
Exceptional
10.1%
Immigrants | Nepal
97.2
/100
|
#85
Exceptional
10.1%
Romanians
97.2
/100
|
#86
Exceptional
10.1%
Burmese
97.2
/100
|
#87
Exceptional
10.1%
Jordanians
97.1
/100
|
#88
Exceptional
10.1%
Immigrants | Bulgaria
97.0
/100
|
#89
Exceptional
10.1%
Ukrainians
96.9
/100
|
#90
Exceptional
10.1%
Puget Sound Salish
96.9
/100
|
#91
Exceptional
10.1%
Immigrants | Singapore
96.9
/100
|
#92
Exceptional
10.1%
Immigrants | Sweden
96.7
/100
|
#93
Exceptional
10.1%
Immigrants | Germany
96.7
/100
|
#94
Exceptional
10.1%
Immigrants | Japan
96.3
/100
|
#95
Exceptional
10.1%
Basques
95.9
/100
|
#96
Exceptional
10.2%
Immigrants | Pakistan
95.7
/100
|
#97
Exceptional
10.2%