Immigrants from Ukraine vs Immigrants from Taiwan Seniors Poverty Over the Age of 75
COMPARE
Immigrants from Ukraine
Immigrants from Taiwan
Seniors Poverty Over the Age of 75
Seniors Poverty Over the Age of 75 Comparison
Immigrants from Ukraine
Immigrants from Taiwan
13.6%
SENIORS POVERTY OVER THE AGE OF 75
0.3/ 100
METRIC RATING
247th/ 347
METRIC RANK
11.4%
SENIORS POVERTY OVER THE AGE OF 75
96.7/ 100
METRIC RATING
65th/ 347
METRIC RANK
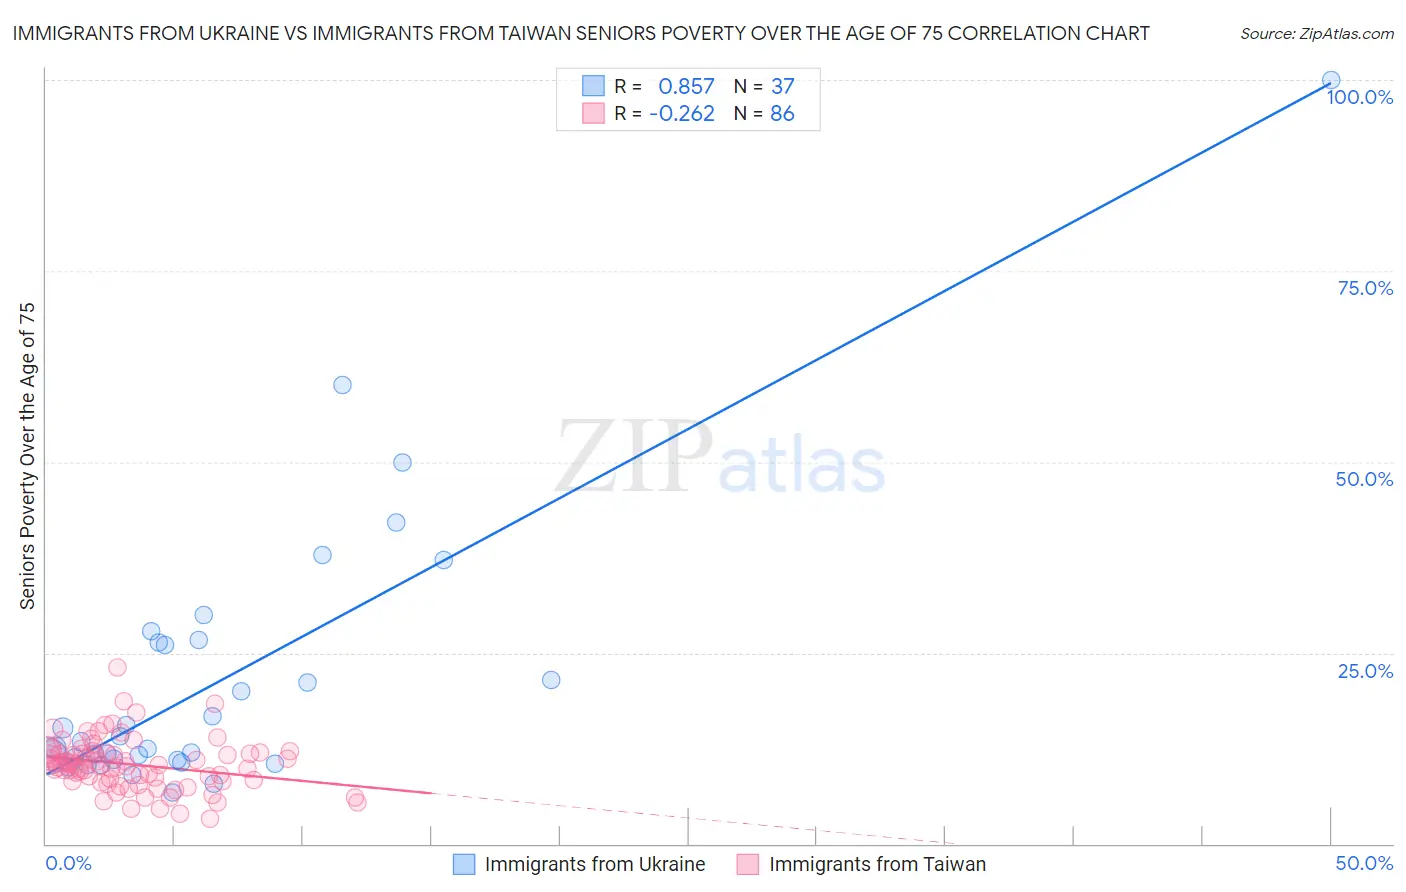
Immigrants from Ukraine vs Immigrants from Taiwan Seniors Poverty Over the Age of 75 Correlation Chart
The statistical analysis conducted on geographies consisting of 287,069,845 people shows a very strong positive correlation between the proportion of Immigrants from Ukraine and poverty level among seniors over the age of 75 in the United States with a correlation coefficient (R) of 0.857 and weighted average of 13.6%. Similarly, the statistical analysis conducted on geographies consisting of 295,351,914 people shows a weak negative correlation between the proportion of Immigrants from Taiwan and poverty level among seniors over the age of 75 in the United States with a correlation coefficient (R) of -0.262 and weighted average of 11.4%, a difference of 19.9%.
Seniors Poverty Over the Age of 75 Correlation Summary
| Measurement | Immigrants from Ukraine | Immigrants from Taiwan |
| Minimum | 6.7% | 3.3% |
| Maximum | 100.0% | 23.1% |
| Range | 93.3% | 19.8% |
| Mean | 21.4% | 10.4% |
| Median | 13.4% | 10.2% |
| Interquartile 25% (IQ1) | 11.0% | 8.2% |
| Interquartile 75% (IQ3) | 26.5% | 11.9% |
| Interquartile Range (IQR) | 15.5% | 3.7% |
| Standard Deviation (Sample) | 18.2% | 3.4% |
| Standard Deviation (Population) | 18.0% | 3.4% |
Similar Demographics by Seniors Poverty Over the Age of 75
Demographics Similar to Immigrants from Ukraine by Seniors Poverty Over the Age of 75
In terms of seniors poverty over the age of 75, the demographic groups most similar to Immigrants from Ukraine are African (13.6%, a difference of 0.030%), Immigrants from Albania (13.6%, a difference of 0.040%), Mexican American Indian (13.6%, a difference of 0.050%), Immigrants from Peru (13.7%, a difference of 0.38%), and Immigrants from Cambodia (13.6%, a difference of 0.40%).
| Demographics | Rating | Rank | Seniors Poverty Over the Age of 75 |
| Argentineans | 0.7 /100 | #240 | Tragic 13.4% |
| Immigrants | Russia | 0.6 /100 | #241 | Tragic 13.4% |
| Immigrants | Somalia | 0.6 /100 | #242 | Tragic 13.5% |
| Dutch West Indians | 0.6 /100 | #243 | Tragic 13.5% |
| Spanish Americans | 0.5 /100 | #244 | Tragic 13.5% |
| Uruguayans | 0.5 /100 | #245 | Tragic 13.5% |
| Immigrants | Cambodia | 0.4 /100 | #246 | Tragic 13.6% |
| Immigrants | Ukraine | 0.3 /100 | #247 | Tragic 13.6% |
| Africans | 0.3 /100 | #248 | Tragic 13.6% |
| Immigrants | Albania | 0.3 /100 | #249 | Tragic 13.6% |
| Mexican American Indians | 0.3 /100 | #250 | Tragic 13.6% |
| Immigrants | Peru | 0.3 /100 | #251 | Tragic 13.7% |
| Immigrants | Argentina | 0.3 /100 | #252 | Tragic 13.7% |
| Immigrants | Spain | 0.2 /100 | #253 | Tragic 13.7% |
| Blackfeet | 0.2 /100 | #254 | Tragic 13.7% |
Demographics Similar to Immigrants from Taiwan by Seniors Poverty Over the Age of 75
In terms of seniors poverty over the age of 75, the demographic groups most similar to Immigrants from Taiwan are Estonian (11.4%, a difference of 0.020%), Bolivian (11.4%, a difference of 0.12%), Immigrants from Austria (11.4%, a difference of 0.14%), Ottawa (11.4%, a difference of 0.15%), and Immigrants from South Central Asia (11.4%, a difference of 0.18%).
| Demographics | Rating | Rank | Seniors Poverty Over the Age of 75 |
| Yugoslavians | 97.9 /100 | #58 | Exceptional 11.2% |
| Immigrants | Netherlands | 97.8 /100 | #59 | Exceptional 11.2% |
| Eastern Europeans | 97.7 /100 | #60 | Exceptional 11.3% |
| Canadians | 97.7 /100 | #61 | Exceptional 11.3% |
| Immigrants | North America | 97.6 /100 | #62 | Exceptional 11.3% |
| Immigrants | Afghanistan | 97.5 /100 | #63 | Exceptional 11.3% |
| Immigrants | Northern Europe | 97.4 /100 | #64 | Exceptional 11.3% |
| Immigrants | Taiwan | 96.7 /100 | #65 | Exceptional 11.4% |
| Estonians | 96.7 /100 | #66 | Exceptional 11.4% |
| Bolivians | 96.5 /100 | #67 | Exceptional 11.4% |
| Immigrants | Austria | 96.5 /100 | #68 | Exceptional 11.4% |
| Ottawa | 96.5 /100 | #69 | Exceptional 11.4% |
| Immigrants | South Central Asia | 96.4 /100 | #70 | Exceptional 11.4% |
| Osage | 96.3 /100 | #71 | Exceptional 11.4% |
| Sierra Leoneans | 96.1 /100 | #72 | Exceptional 11.4% |