Fijian vs Immigrants from Taiwan Seniors Poverty Over the Age of 75
COMPARE
Fijian
Immigrants from Taiwan
Seniors Poverty Over the Age of 75
Seniors Poverty Over the Age of 75 Comparison
Fijians
Immigrants from Taiwan
11.8%
SENIORS POVERTY OVER THE AGE OF 75
83.8/ 100
METRIC RATING
124th/ 347
METRIC RANK
11.4%
SENIORS POVERTY OVER THE AGE OF 75
96.7/ 100
METRIC RATING
65th/ 347
METRIC RANK
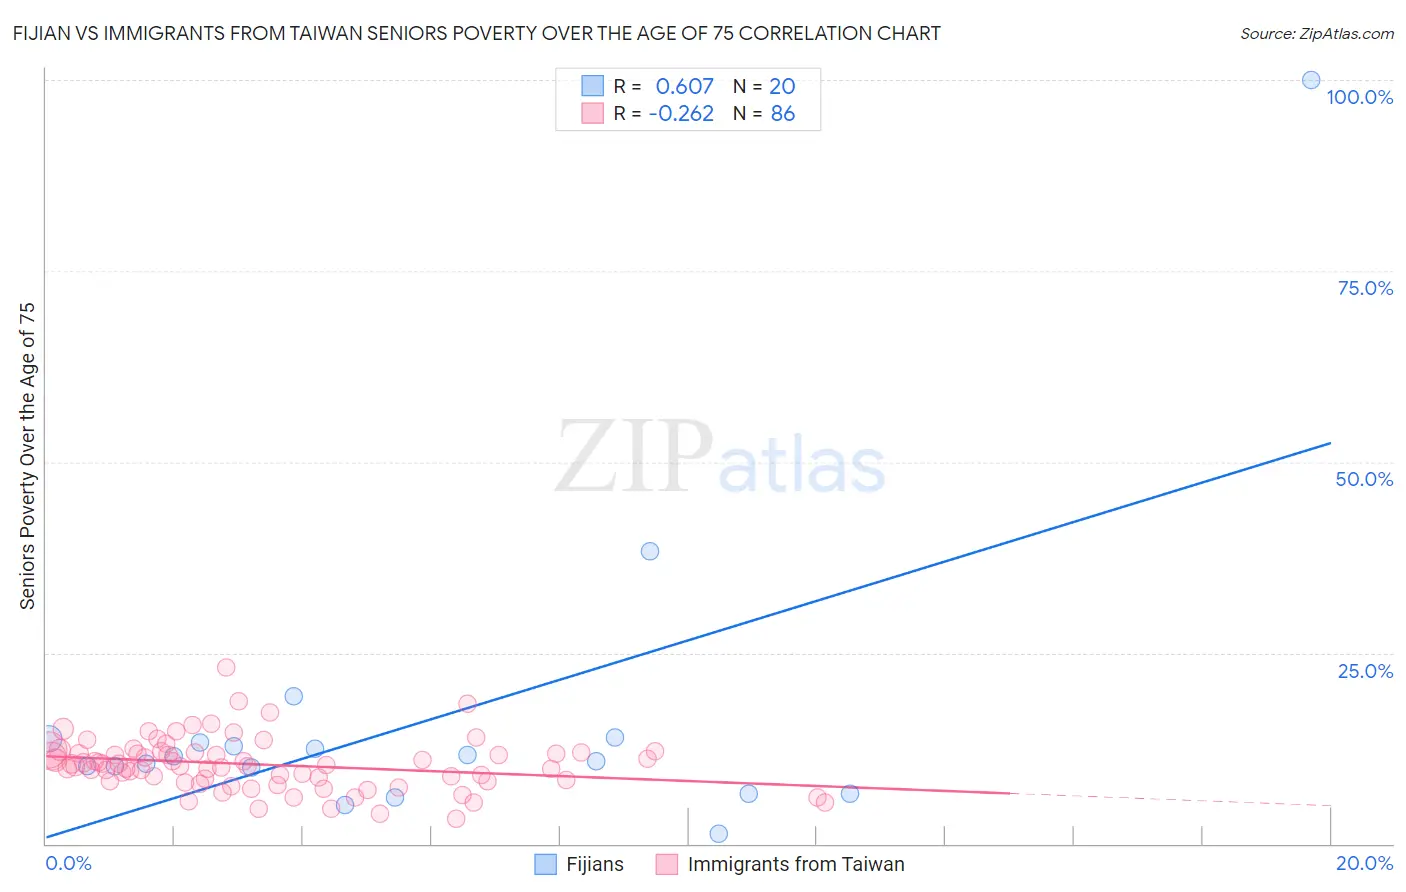
Fijian vs Immigrants from Taiwan Seniors Poverty Over the Age of 75 Correlation Chart
The statistical analysis conducted on geographies consisting of 55,762,719 people shows a significant positive correlation between the proportion of Fijians and poverty level among seniors over the age of 75 in the United States with a correlation coefficient (R) of 0.607 and weighted average of 11.8%. Similarly, the statistical analysis conducted on geographies consisting of 295,351,914 people shows a weak negative correlation between the proportion of Immigrants from Taiwan and poverty level among seniors over the age of 75 in the United States with a correlation coefficient (R) of -0.262 and weighted average of 11.4%, a difference of 3.8%.
Seniors Poverty Over the Age of 75 Correlation Summary
| Measurement | Fijian | Immigrants from Taiwan |
| Minimum | 1.2% | 3.3% |
| Maximum | 100.0% | 23.1% |
| Range | 98.8% | 19.8% |
| Mean | 16.2% | 10.4% |
| Median | 11.1% | 10.2% |
| Interquartile 25% (IQ1) | 8.2% | 8.2% |
| Interquartile 75% (IQ3) | 13.5% | 11.9% |
| Interquartile Range (IQR) | 5.3% | 3.7% |
| Standard Deviation (Sample) | 21.1% | 3.4% |
| Standard Deviation (Population) | 20.5% | 3.4% |
Similar Demographics by Seniors Poverty Over the Age of 75
Demographics Similar to Fijians by Seniors Poverty Over the Age of 75
In terms of seniors poverty over the age of 75, the demographic groups most similar to Fijians are Pakistani (11.8%, a difference of 0.030%), Immigrants from Italy (11.8%, a difference of 0.030%), Sudanese (11.8%, a difference of 0.030%), Malaysian (11.8%, a difference of 0.040%), and Pennsylvania German (11.8%, a difference of 0.060%).
| Demographics | Rating | Rank | Seniors Poverty Over the Age of 75 |
| Icelanders | 85.7 /100 | #117 | Excellent 11.7% |
| Immigrants | Zimbabwe | 85.5 /100 | #118 | Excellent 11.7% |
| Immigrants | Uganda | 84.8 /100 | #119 | Excellent 11.8% |
| Immigrants | Nepal | 84.5 /100 | #120 | Excellent 11.8% |
| Malaysians | 84.1 /100 | #121 | Excellent 11.8% |
| Pakistanis | 84.0 /100 | #122 | Excellent 11.8% |
| Immigrants | Italy | 84.0 /100 | #123 | Excellent 11.8% |
| Fijians | 83.8 /100 | #124 | Excellent 11.8% |
| Sudanese | 83.6 /100 | #125 | Excellent 11.8% |
| Pennsylvania Germans | 83.4 /100 | #126 | Excellent 11.8% |
| Immigrants | Denmark | 82.6 /100 | #127 | Excellent 11.8% |
| Immigrants | Hungary | 81.7 /100 | #128 | Excellent 11.8% |
| Ethiopians | 80.7 /100 | #129 | Excellent 11.8% |
| Spanish | 80.5 /100 | #130 | Excellent 11.8% |
| Immigrants | Western Europe | 79.6 /100 | #131 | Good 11.9% |
Demographics Similar to Immigrants from Taiwan by Seniors Poverty Over the Age of 75
In terms of seniors poverty over the age of 75, the demographic groups most similar to Immigrants from Taiwan are Estonian (11.4%, a difference of 0.020%), Bolivian (11.4%, a difference of 0.12%), Immigrants from Austria (11.4%, a difference of 0.14%), Ottawa (11.4%, a difference of 0.15%), and Immigrants from South Central Asia (11.4%, a difference of 0.18%).
| Demographics | Rating | Rank | Seniors Poverty Over the Age of 75 |
| Yugoslavians | 97.9 /100 | #58 | Exceptional 11.2% |
| Immigrants | Netherlands | 97.8 /100 | #59 | Exceptional 11.2% |
| Eastern Europeans | 97.7 /100 | #60 | Exceptional 11.3% |
| Canadians | 97.7 /100 | #61 | Exceptional 11.3% |
| Immigrants | North America | 97.6 /100 | #62 | Exceptional 11.3% |
| Immigrants | Afghanistan | 97.5 /100 | #63 | Exceptional 11.3% |
| Immigrants | Northern Europe | 97.4 /100 | #64 | Exceptional 11.3% |
| Immigrants | Taiwan | 96.7 /100 | #65 | Exceptional 11.4% |
| Estonians | 96.7 /100 | #66 | Exceptional 11.4% |
| Bolivians | 96.5 /100 | #67 | Exceptional 11.4% |
| Immigrants | Austria | 96.5 /100 | #68 | Exceptional 11.4% |
| Ottawa | 96.5 /100 | #69 | Exceptional 11.4% |
| Immigrants | South Central Asia | 96.4 /100 | #70 | Exceptional 11.4% |
| Osage | 96.3 /100 | #71 | Exceptional 11.4% |
| Sierra Leoneans | 96.1 /100 | #72 | Exceptional 11.4% |