Immigrants from Ukraine vs Immigrants from Oceania Receiving Food Stamps
COMPARE
Immigrants from Ukraine
Immigrants from Oceania
Receiving Food Stamps
Receiving Food Stamps Comparison
Immigrants from Ukraine
Immigrants from Oceania
11.8%
RECEIVING FOOD STAMPS
48.4/ 100
METRIC RATING
177th/ 347
METRIC RANK
11.4%
RECEIVING FOOD STAMPS
70.4/ 100
METRIC RATING
159th/ 347
METRIC RANK
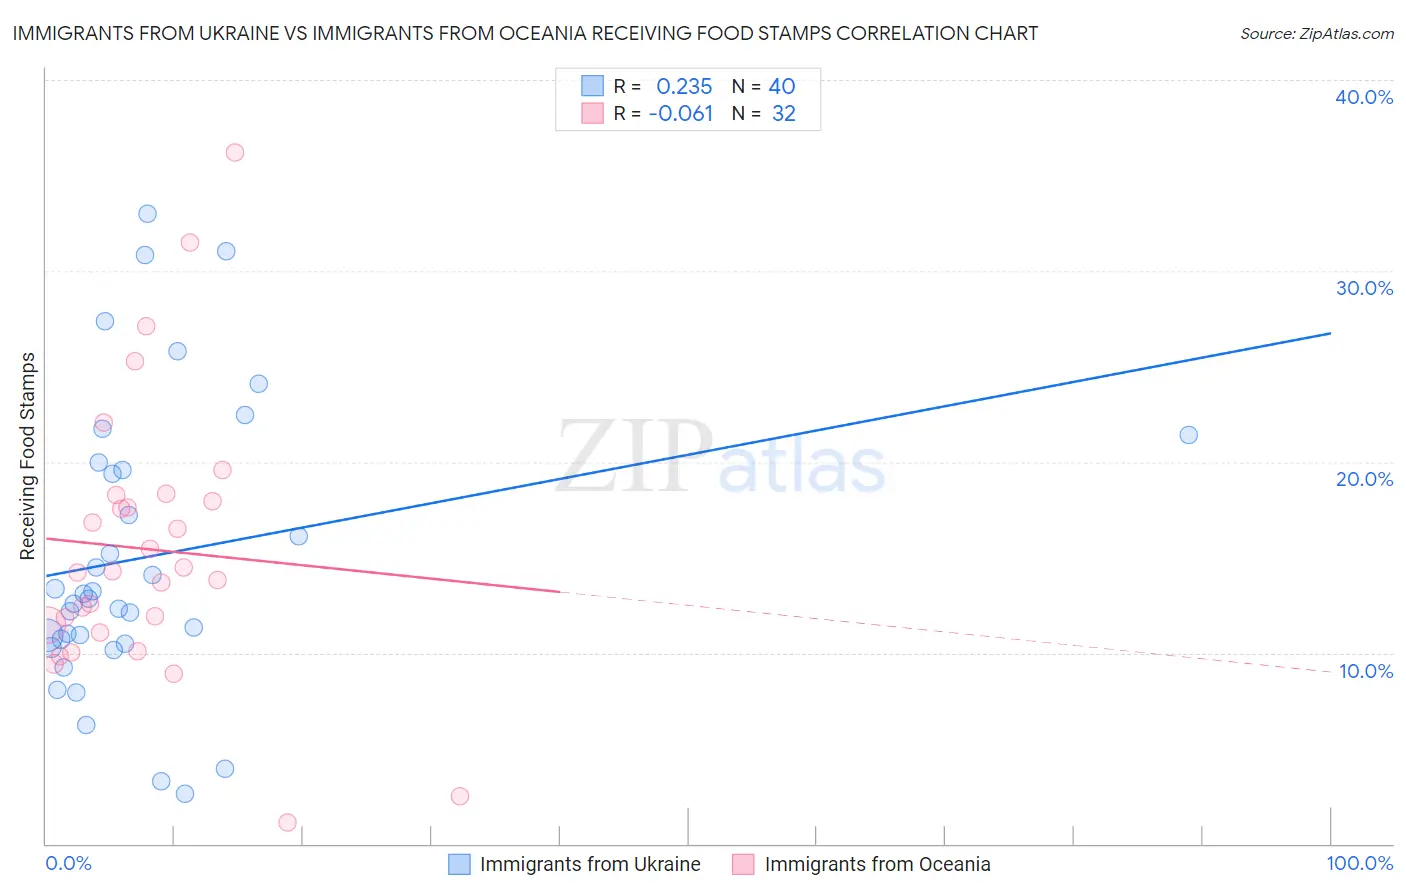
Immigrants from Ukraine vs Immigrants from Oceania Receiving Food Stamps Correlation Chart
The statistical analysis conducted on geographies consisting of 288,996,069 people shows a weak positive correlation between the proportion of Immigrants from Ukraine and percentage of population receiving government assistance and/or food stamps in the United States with a correlation coefficient (R) of 0.235 and weighted average of 11.8%. Similarly, the statistical analysis conducted on geographies consisting of 304,706,575 people shows a slight negative correlation between the proportion of Immigrants from Oceania and percentage of population receiving government assistance and/or food stamps in the United States with a correlation coefficient (R) of -0.061 and weighted average of 11.4%, a difference of 3.4%.
Receiving Food Stamps Correlation Summary
| Measurement | Immigrants from Ukraine | Immigrants from Oceania |
| Minimum | 2.6% | 1.1% |
| Maximum | 33.0% | 36.2% |
| Range | 30.4% | 35.1% |
| Mean | 15.1% | 15.4% |
| Median | 12.9% | 14.2% |
| Interquartile 25% (IQ1) | 10.6% | 11.2% |
| Interquartile 75% (IQ3) | 19.8% | 18.1% |
| Interquartile Range (IQR) | 9.2% | 6.9% |
| Standard Deviation (Sample) | 7.5% | 7.3% |
| Standard Deviation (Population) | 7.4% | 7.2% |
Demographics Similar to Immigrants from Ukraine and Immigrants from Oceania by Receiving Food Stamps
In terms of receiving food stamps, the demographic groups most similar to Immigrants from Ukraine are German Russian (11.8%, a difference of 0.040%), Peruvian (11.7%, a difference of 0.13%), Osage (11.7%, a difference of 0.21%), Immigrants from Eritrea (11.7%, a difference of 0.23%), and Immigrants from Syria (11.7%, a difference of 0.71%). Similarly, the demographic groups most similar to Immigrants from Oceania are French Canadian (11.4%, a difference of 0.16%), Pennsylvania German (11.4%, a difference of 0.34%), Immigrants from Bosnia and Herzegovina (11.3%, a difference of 0.39%), Alsatian (11.4%, a difference of 0.41%), and Immigrants from Southern Europe (11.5%, a difference of 0.78%).
| Demographics | Rating | Rank | Receiving Food Stamps |
| Immigrants | Bosnia and Herzegovina | 72.6 /100 | #158 | Good 11.3% |
| Immigrants | Oceania | 70.4 /100 | #159 | Good 11.4% |
| French Canadians | 69.5 /100 | #160 | Good 11.4% |
| Pennsylvania Germans | 68.4 /100 | #161 | Good 11.4% |
| Alsatians | 68.0 /100 | #162 | Good 11.4% |
| Immigrants | Southern Europe | 65.8 /100 | #163 | Good 11.5% |
| Immigrants | Chile | 65.0 /100 | #164 | Good 11.5% |
| Arabs | 64.7 /100 | #165 | Good 11.5% |
| Immigrants | Belarus | 62.8 /100 | #166 | Good 11.5% |
| Kenyans | 60.2 /100 | #167 | Good 11.6% |
| Tlingit-Haida | 59.1 /100 | #168 | Average 11.6% |
| Immigrants | Eastern Africa | 58.3 /100 | #169 | Average 11.6% |
| Costa Ricans | 57.9 /100 | #170 | Average 11.6% |
| Immigrants | Western Asia | 56.4 /100 | #171 | Average 11.6% |
| Guamanians/Chamorros | 54.2 /100 | #172 | Average 11.7% |
| Immigrants | Syria | 53.4 /100 | #173 | Average 11.7% |
| Immigrants | Eritrea | 50.0 /100 | #174 | Average 11.7% |
| Osage | 49.8 /100 | #175 | Average 11.7% |
| Peruvians | 49.3 /100 | #176 | Average 11.7% |
| Immigrants | Ukraine | 48.4 /100 | #177 | Average 11.8% |
| German Russians | 48.1 /100 | #178 | Average 11.8% |