Immigrants from Ukraine vs Burmese Child Poverty Among Boys Under 16
COMPARE
Immigrants from Ukraine
Burmese
Child Poverty Among Boys Under 16
Child Poverty Among Boys Under 16 Comparison
Immigrants from Ukraine
Burmese
15.2%
CHILD POVERTY AMONG BOYS UNDER 16
93.6/ 100
METRIC RATING
114th/ 347
METRIC RANK
13.0%
CHILD POVERTY AMONG BOYS UNDER 16
99.9/ 100
METRIC RATING
12th/ 347
METRIC RANK
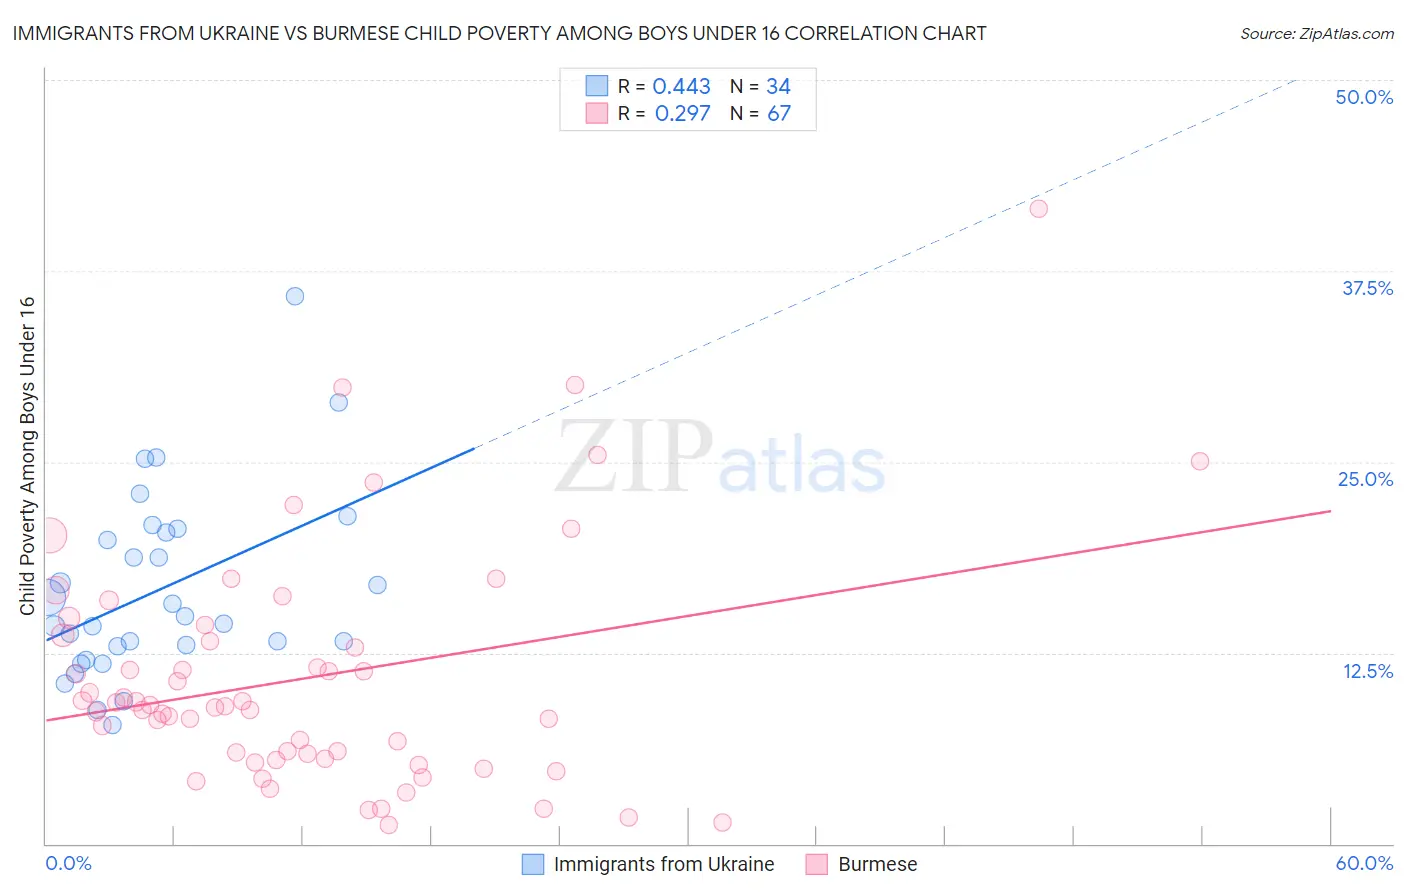
Immigrants from Ukraine vs Burmese Child Poverty Among Boys Under 16 Correlation Chart
The statistical analysis conducted on geographies consisting of 285,223,782 people shows a moderate positive correlation between the proportion of Immigrants from Ukraine and poverty level among boys under the age of 16 in the United States with a correlation coefficient (R) of 0.443 and weighted average of 15.2%. Similarly, the statistical analysis conducted on geographies consisting of 454,977,536 people shows a weak positive correlation between the proportion of Burmese and poverty level among boys under the age of 16 in the United States with a correlation coefficient (R) of 0.297 and weighted average of 13.0%, a difference of 17.2%.
Child Poverty Among Boys Under 16 Correlation Summary
| Measurement | Immigrants from Ukraine | Burmese |
| Minimum | 7.8% | 1.2% |
| Maximum | 35.8% | 41.5% |
| Range | 28.0% | 40.3% |
| Mean | 16.6% | 10.9% |
| Median | 14.6% | 9.0% |
| Interquartile 25% (IQ1) | 12.9% | 5.6% |
| Interquartile 75% (IQ3) | 20.4% | 13.7% |
| Interquartile Range (IQR) | 7.5% | 8.1% |
| Standard Deviation (Sample) | 6.1% | 7.7% |
| Standard Deviation (Population) | 6.0% | 7.6% |
Similar Demographics by Child Poverty Among Boys Under 16
Demographics Similar to Immigrants from Ukraine by Child Poverty Among Boys Under 16
In terms of child poverty among boys under 16, the demographic groups most similar to Immigrants from Ukraine are Armenian (15.2%, a difference of 0.010%), Irish (15.2%, a difference of 0.050%), Immigrants from South Eastern Asia (15.2%, a difference of 0.060%), Immigrants from Vietnam (15.2%, a difference of 0.080%), and Basque (15.2%, a difference of 0.090%).
| Demographics | Rating | Rank | Child Poverty Among Boys Under 16 |
| Jordanians | 95.1 /100 | #107 | Exceptional 15.1% |
| Immigrants | England | 94.8 /100 | #108 | Exceptional 15.1% |
| Pakistanis | 94.7 /100 | #109 | Exceptional 15.1% |
| English | 94.3 /100 | #110 | Exceptional 15.1% |
| Immigrants | Zimbabwe | 94.2 /100 | #111 | Exceptional 15.2% |
| Basques | 93.8 /100 | #112 | Exceptional 15.2% |
| Irish | 93.8 /100 | #113 | Exceptional 15.2% |
| Immigrants | Ukraine | 93.6 /100 | #114 | Exceptional 15.2% |
| Armenians | 93.6 /100 | #115 | Exceptional 15.2% |
| Immigrants | South Eastern Asia | 93.5 /100 | #116 | Exceptional 15.2% |
| Immigrants | Vietnam | 93.5 /100 | #117 | Exceptional 15.2% |
| Native Hawaiians | 93.4 /100 | #118 | Exceptional 15.2% |
| Belgians | 93.1 /100 | #119 | Exceptional 15.2% |
| South Africans | 93.0 /100 | #120 | Exceptional 15.2% |
| Scottish | 93.0 /100 | #121 | Exceptional 15.2% |
Demographics Similar to Burmese by Child Poverty Among Boys Under 16
In terms of child poverty among boys under 16, the demographic groups most similar to Burmese are Immigrants from Korea (13.0%, a difference of 0.50%), Immigrants from Ireland (13.1%, a difference of 1.2%), Immigrants from Japan (13.1%, a difference of 1.3%), Maltese (13.2%, a difference of 1.6%), and Norwegian (13.2%, a difference of 1.7%).
| Demographics | Rating | Rank | Child Poverty Among Boys Under 16 |
| Chinese | 100.0 /100 | #5 | Exceptional 11.9% |
| Immigrants | Hong Kong | 100.0 /100 | #6 | Exceptional 12.3% |
| Iranians | 100.0 /100 | #7 | Exceptional 12.4% |
| Immigrants | Singapore | 100.0 /100 | #8 | Exceptional 12.5% |
| Immigrants | Iran | 100.0 /100 | #9 | Exceptional 12.5% |
| Bhutanese | 100.0 /100 | #10 | Exceptional 12.6% |
| Immigrants | South Central Asia | 100.0 /100 | #11 | Exceptional 12.7% |
| Burmese | 99.9 /100 | #12 | Exceptional 13.0% |
| Immigrants | Korea | 99.9 /100 | #13 | Exceptional 13.0% |
| Immigrants | Ireland | 99.9 /100 | #14 | Exceptional 13.1% |
| Immigrants | Japan | 99.9 /100 | #15 | Exceptional 13.1% |
| Maltese | 99.9 /100 | #16 | Exceptional 13.2% |
| Norwegians | 99.9 /100 | #17 | Exceptional 13.2% |
| Bulgarians | 99.9 /100 | #18 | Exceptional 13.3% |
| Bolivians | 99.9 /100 | #19 | Exceptional 13.3% |