Immigrants from Trinidad and Tobago vs Venezuelan Seniors Poverty Over the Age of 75
COMPARE
Immigrants from Trinidad and Tobago
Venezuelan
Seniors Poverty Over the Age of 75
Seniors Poverty Over the Age of 75 Comparison
Immigrants from Trinidad and Tobago
Venezuelans
15.7%
SENIORS POVERTY OVER THE AGE OF 75
0.0/ 100
METRIC RATING
304th/ 347
METRIC RANK
14.2%
SENIORS POVERTY OVER THE AGE OF 75
0.0/ 100
METRIC RATING
267th/ 347
METRIC RANK
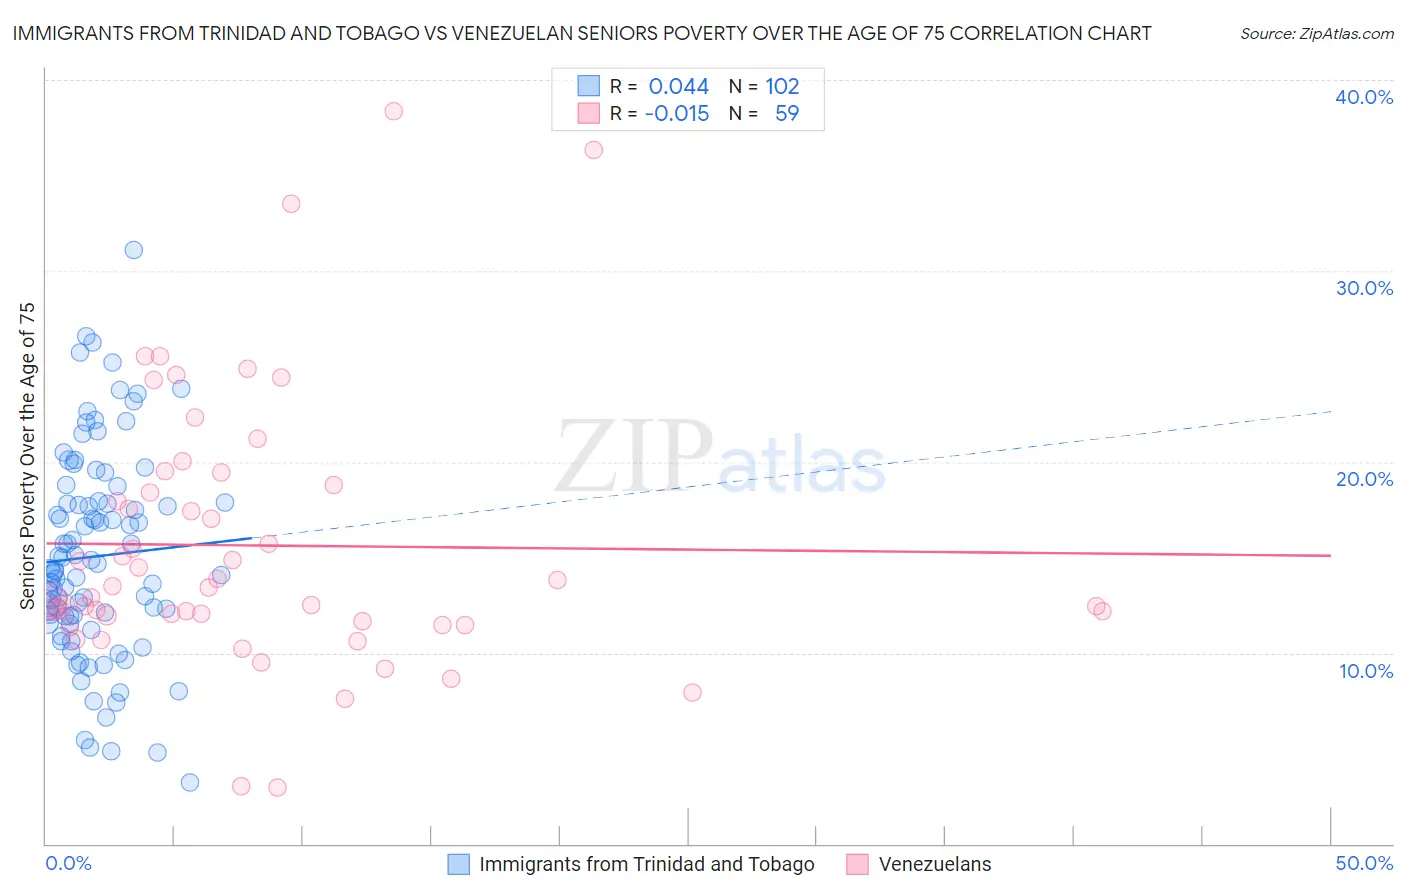
Immigrants from Trinidad and Tobago vs Venezuelan Seniors Poverty Over the Age of 75 Correlation Chart
The statistical analysis conducted on geographies consisting of 222,011,128 people shows no correlation between the proportion of Immigrants from Trinidad and Tobago and poverty level among seniors over the age of 75 in the United States with a correlation coefficient (R) of 0.044 and weighted average of 15.7%. Similarly, the statistical analysis conducted on geographies consisting of 303,492,801 people shows no correlation between the proportion of Venezuelans and poverty level among seniors over the age of 75 in the United States with a correlation coefficient (R) of -0.015 and weighted average of 14.2%, a difference of 10.8%.
Seniors Poverty Over the Age of 75 Correlation Summary
| Measurement | Immigrants from Trinidad and Tobago | Venezuelan |
| Minimum | 3.2% | 2.9% |
| Maximum | 31.1% | 38.4% |
| Range | 27.9% | 35.4% |
| Mean | 15.1% | 15.6% |
| Median | 14.4% | 13.5% |
| Interquartile 25% (IQ1) | 11.9% | 11.6% |
| Interquartile 75% (IQ3) | 17.8% | 18.8% |
| Interquartile Range (IQR) | 5.9% | 7.1% |
| Standard Deviation (Sample) | 5.4% | 7.0% |
| Standard Deviation (Population) | 5.4% | 7.0% |
Similar Demographics by Seniors Poverty Over the Age of 75
Demographics Similar to Immigrants from Trinidad and Tobago by Seniors Poverty Over the Age of 75
In terms of seniors poverty over the age of 75, the demographic groups most similar to Immigrants from Trinidad and Tobago are Ecuadorian (15.7%, a difference of 0.040%), Immigrants from Honduras (15.7%, a difference of 0.18%), Hispanic or Latino (15.8%, a difference of 0.20%), Immigrants from West Indies (15.8%, a difference of 0.34%), and West Indian (15.7%, a difference of 0.35%).
| Demographics | Rating | Rank | Seniors Poverty Over the Age of 75 |
| Hondurans | 0.0 /100 | #297 | Tragic 15.4% |
| Natives/Alaskans | 0.0 /100 | #298 | Tragic 15.5% |
| Spanish American Indians | 0.0 /100 | #299 | Tragic 15.5% |
| Bahamians | 0.0 /100 | #300 | Tragic 15.5% |
| Immigrants | Latin America | 0.0 /100 | #301 | Tragic 15.6% |
| West Indians | 0.0 /100 | #302 | Tragic 15.7% |
| Immigrants | Honduras | 0.0 /100 | #303 | Tragic 15.7% |
| Immigrants | Trinidad and Tobago | 0.0 /100 | #304 | Tragic 15.7% |
| Ecuadorians | 0.0 /100 | #305 | Tragic 15.7% |
| Hispanics or Latinos | 0.0 /100 | #306 | Tragic 15.8% |
| Immigrants | West Indies | 0.0 /100 | #307 | Tragic 15.8% |
| Immigrants | Bangladesh | 0.0 /100 | #308 | Tragic 15.8% |
| Yup'ik | 0.0 /100 | #309 | Tragic 15.8% |
| Vietnamese | 0.0 /100 | #310 | Tragic 15.9% |
| Trinidadians and Tobagonians | 0.0 /100 | #311 | Tragic 15.9% |
Demographics Similar to Venezuelans by Seniors Poverty Over the Age of 75
In terms of seniors poverty over the age of 75, the demographic groups most similar to Venezuelans are Armenian (14.2%, a difference of 0.020%), Salvadoran (14.2%, a difference of 0.24%), Colombian (14.3%, a difference of 0.35%), Immigrants from Venezuela (14.3%, a difference of 0.46%), and South American (14.1%, a difference of 0.48%).
| Demographics | Rating | Rank | Seniors Poverty Over the Age of 75 |
| Immigrants | Immigrants | 0.1 /100 | #260 | Tragic 13.9% |
| Ghanaians | 0.1 /100 | #261 | Tragic 14.0% |
| Cajuns | 0.1 /100 | #262 | Tragic 14.0% |
| Iroquois | 0.1 /100 | #263 | Tragic 14.0% |
| South Americans | 0.0 /100 | #264 | Tragic 14.1% |
| Salvadorans | 0.0 /100 | #265 | Tragic 14.2% |
| Armenians | 0.0 /100 | #266 | Tragic 14.2% |
| Venezuelans | 0.0 /100 | #267 | Tragic 14.2% |
| Colombians | 0.0 /100 | #268 | Tragic 14.3% |
| Immigrants | Venezuela | 0.0 /100 | #269 | Tragic 14.3% |
| Immigrants | Uruguay | 0.0 /100 | #270 | Tragic 14.3% |
| Immigrants | Ghana | 0.0 /100 | #271 | Tragic 14.4% |
| Mexicans | 0.0 /100 | #272 | Tragic 14.4% |
| Immigrants | South America | 0.0 /100 | #273 | Tragic 14.4% |
| Immigrants | Bahamas | 0.0 /100 | #274 | Tragic 14.4% |