Immigrants from Colombia vs Venezuelan Seniors Poverty Over the Age of 75
COMPARE
Immigrants from Colombia
Venezuelan
Seniors Poverty Over the Age of 75
Seniors Poverty Over the Age of 75 Comparison
Immigrants from Colombia
Venezuelans
14.6%
SENIORS POVERTY OVER THE AGE OF 75
0.0/ 100
METRIC RATING
278th/ 347
METRIC RANK
14.2%
SENIORS POVERTY OVER THE AGE OF 75
0.0/ 100
METRIC RATING
267th/ 347
METRIC RANK
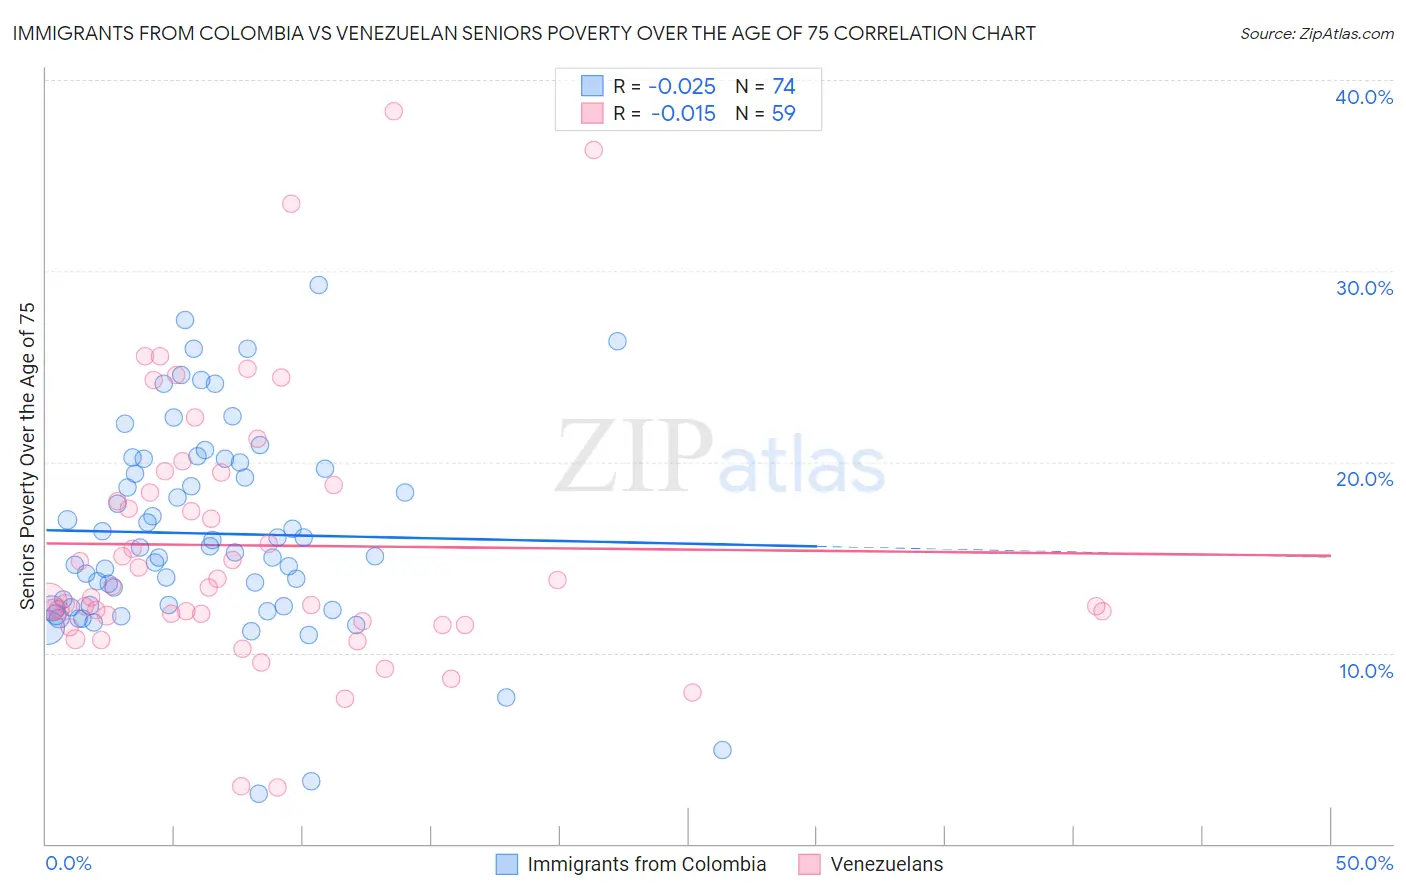
Immigrants from Colombia vs Venezuelan Seniors Poverty Over the Age of 75 Correlation Chart
The statistical analysis conducted on geographies consisting of 374,797,276 people shows no correlation between the proportion of Immigrants from Colombia and poverty level among seniors over the age of 75 in the United States with a correlation coefficient (R) of -0.025 and weighted average of 14.6%. Similarly, the statistical analysis conducted on geographies consisting of 303,492,801 people shows no correlation between the proportion of Venezuelans and poverty level among seniors over the age of 75 in the United States with a correlation coefficient (R) of -0.015 and weighted average of 14.2%, a difference of 2.9%.
Seniors Poverty Over the Age of 75 Correlation Summary
| Measurement | Immigrants from Colombia | Venezuelan |
| Minimum | 2.6% | 2.9% |
| Maximum | 29.3% | 38.4% |
| Range | 26.6% | 35.4% |
| Mean | 16.2% | 15.6% |
| Median | 15.4% | 13.5% |
| Interquartile 25% (IQ1) | 12.4% | 11.6% |
| Interquartile 75% (IQ3) | 20.0% | 18.8% |
| Interquartile Range (IQR) | 7.6% | 7.1% |
| Standard Deviation (Sample) | 5.3% | 7.0% |
| Standard Deviation (Population) | 5.3% | 7.0% |
Demographics Similar to Immigrants from Colombia and Venezuelans by Seniors Poverty Over the Age of 75
In terms of seniors poverty over the age of 75, the demographic groups most similar to Immigrants from Colombia are Black/African American (14.6%, a difference of 0.21%), Senegalese (14.5%, a difference of 0.77%), Central American (14.7%, a difference of 0.85%), Belizean (14.8%, a difference of 0.97%), and Soviet Union (14.5%, a difference of 1.1%). Similarly, the demographic groups most similar to Venezuelans are Armenian (14.2%, a difference of 0.020%), Salvadoran (14.2%, a difference of 0.24%), Colombian (14.3%, a difference of 0.35%), Immigrants from Venezuela (14.3%, a difference of 0.46%), and South American (14.1%, a difference of 0.48%).
| Demographics | Rating | Rank | Seniors Poverty Over the Age of 75 |
| Cajuns | 0.1 /100 | #262 | Tragic 14.0% |
| Iroquois | 0.1 /100 | #263 | Tragic 14.0% |
| South Americans | 0.0 /100 | #264 | Tragic 14.1% |
| Salvadorans | 0.0 /100 | #265 | Tragic 14.2% |
| Armenians | 0.0 /100 | #266 | Tragic 14.2% |
| Venezuelans | 0.0 /100 | #267 | Tragic 14.2% |
| Colombians | 0.0 /100 | #268 | Tragic 14.3% |
| Immigrants | Venezuela | 0.0 /100 | #269 | Tragic 14.3% |
| Immigrants | Uruguay | 0.0 /100 | #270 | Tragic 14.3% |
| Immigrants | Ghana | 0.0 /100 | #271 | Tragic 14.4% |
| Mexicans | 0.0 /100 | #272 | Tragic 14.4% |
| Immigrants | South America | 0.0 /100 | #273 | Tragic 14.4% |
| Immigrants | Bahamas | 0.0 /100 | #274 | Tragic 14.4% |
| Immigrants | El Salvador | 0.0 /100 | #275 | Tragic 14.5% |
| Soviet Union | 0.0 /100 | #276 | Tragic 14.5% |
| Senegalese | 0.0 /100 | #277 | Tragic 14.5% |
| Immigrants | Colombia | 0.0 /100 | #278 | Tragic 14.6% |
| Blacks/African Americans | 0.0 /100 | #279 | Tragic 14.6% |
| Central Americans | 0.0 /100 | #280 | Tragic 14.7% |
| Belizeans | 0.0 /100 | #281 | Tragic 14.8% |
| Immigrants | Senegal | 0.0 /100 | #282 | Tragic 14.8% |