Immigrants from Trinidad and Tobago vs Indian (Asian) Male Poverty
COMPARE
Immigrants from Trinidad and Tobago
Indian (Asian)
Male Poverty
Male Poverty Comparison
Immigrants from Trinidad and Tobago
Indians (Asian)
13.1%
MALE POVERTY
0.1/ 100
METRIC RATING
257th/ 347
METRIC RANK
10.4%
MALE POVERTY
94.9/ 100
METRIC RATING
90th/ 347
METRIC RANK
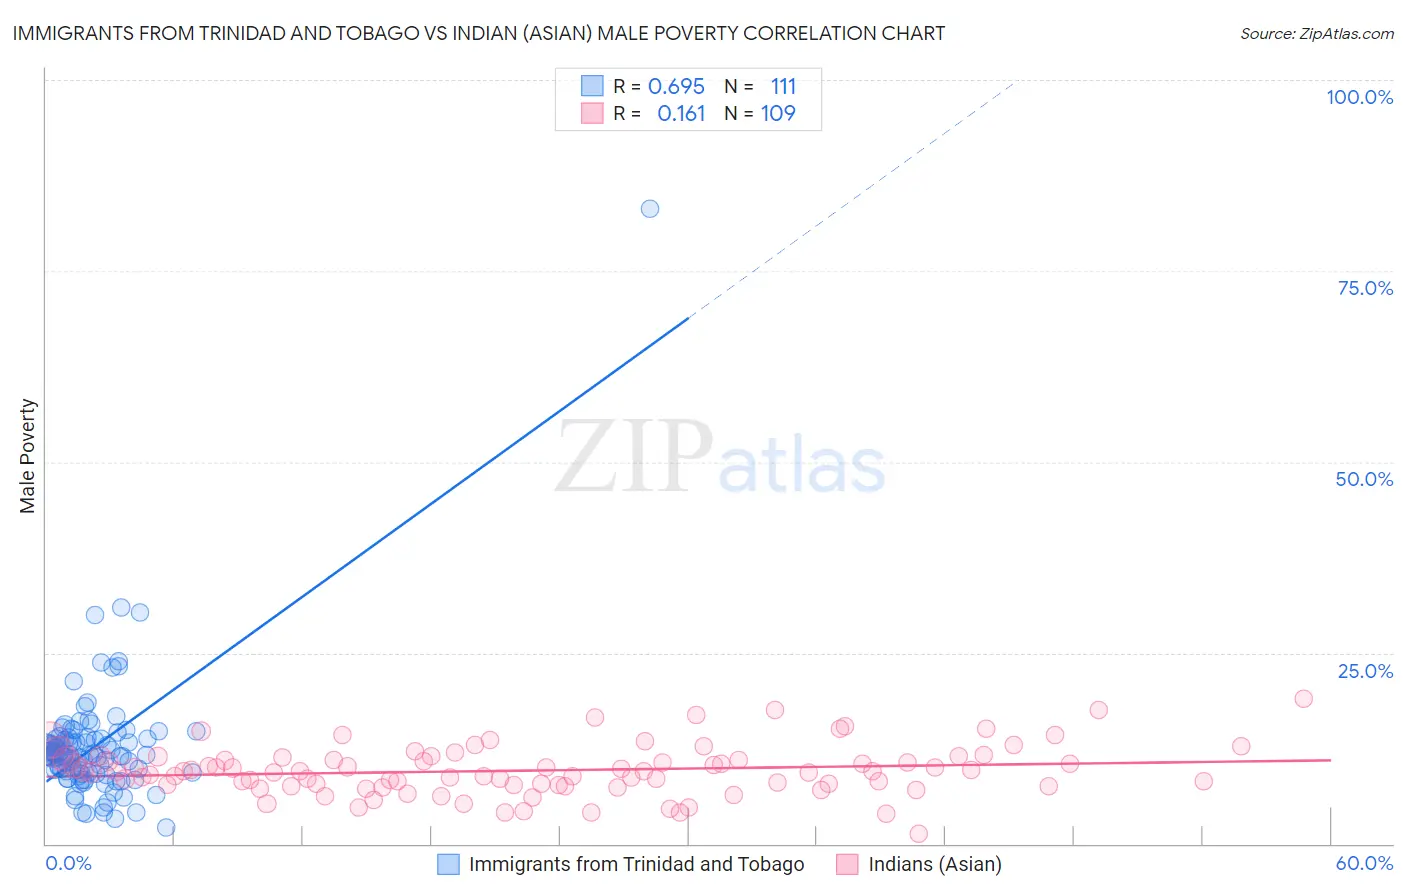
Immigrants from Trinidad and Tobago vs Indian (Asian) Male Poverty Correlation Chart
The statistical analysis conducted on geographies consisting of 223,466,412 people shows a significant positive correlation between the proportion of Immigrants from Trinidad and Tobago and poverty level among males in the United States with a correlation coefficient (R) of 0.695 and weighted average of 13.1%. Similarly, the statistical analysis conducted on geographies consisting of 494,421,628 people shows a poor positive correlation between the proportion of Indians (Asian) and poverty level among males in the United States with a correlation coefficient (R) of 0.161 and weighted average of 10.4%, a difference of 25.7%.
Male Poverty Correlation Summary
| Measurement | Immigrants from Trinidad and Tobago | Indian (Asian) |
| Minimum | 2.1% | 1.3% |
| Maximum | 83.2% | 19.1% |
| Range | 81.1% | 17.7% |
| Mean | 12.7% | 9.6% |
| Median | 11.6% | 9.5% |
| Interquartile 25% (IQ1) | 9.3% | 7.7% |
| Interquartile 75% (IQ3) | 13.7% | 11.1% |
| Interquartile Range (IQR) | 4.4% | 3.5% |
| Standard Deviation (Sample) | 8.4% | 3.2% |
| Standard Deviation (Population) | 8.4% | 3.2% |
Similar Demographics by Male Poverty
Demographics Similar to Immigrants from Trinidad and Tobago by Male Poverty
In terms of male poverty, the demographic groups most similar to Immigrants from Trinidad and Tobago are Cape Verdean (13.1%, a difference of 0.13%), Immigrants from Burma/Myanmar (13.0%, a difference of 0.26%), Cherokee (13.1%, a difference of 0.29%), Ottawa (13.1%, a difference of 0.40%), and Trinidadian and Tobagonian (13.1%, a difference of 0.42%).
| Demographics | Rating | Rank | Male Poverty |
| Immigrants | Nicaragua | 0.2 /100 | #250 | Tragic 12.9% |
| Immigrants | Cuba | 0.2 /100 | #251 | Tragic 12.9% |
| Immigrants | Ecuador | 0.2 /100 | #252 | Tragic 12.9% |
| Immigrants | Ghana | 0.2 /100 | #253 | Tragic 12.9% |
| Mexican American Indians | 0.1 /100 | #254 | Tragic 13.0% |
| Immigrants | Liberia | 0.1 /100 | #255 | Tragic 13.0% |
| Immigrants | Burma/Myanmar | 0.1 /100 | #256 | Tragic 13.0% |
| Immigrants | Trinidad and Tobago | 0.1 /100 | #257 | Tragic 13.1% |
| Cape Verdeans | 0.1 /100 | #258 | Tragic 13.1% |
| Cherokee | 0.1 /100 | #259 | Tragic 13.1% |
| Ottawa | 0.1 /100 | #260 | Tragic 13.1% |
| Trinidadians and Tobagonians | 0.1 /100 | #261 | Tragic 13.1% |
| Spanish American Indians | 0.1 /100 | #262 | Tragic 13.1% |
| Central Americans | 0.1 /100 | #263 | Tragic 13.2% |
| Iroquois | 0.1 /100 | #264 | Tragic 13.2% |
Demographics Similar to Indians (Asian) by Male Poverty
In terms of male poverty, the demographic groups most similar to Indians (Asian) are Immigrants from Denmark (10.4%, a difference of 0.020%), Cambodian (10.4%, a difference of 0.030%), British (10.4%, a difference of 0.070%), Northern European (10.4%, a difference of 0.17%), and Immigrants from Eastern Asia (10.4%, a difference of 0.20%).
| Demographics | Rating | Rank | Male Poverty |
| Immigrants | Sweden | 95.7 /100 | #83 | Exceptional 10.3% |
| Czechoslovakians | 95.6 /100 | #84 | Exceptional 10.3% |
| Immigrants | England | 95.5 /100 | #85 | Exceptional 10.4% |
| Immigrants | Eastern Asia | 95.3 /100 | #86 | Exceptional 10.4% |
| Northern Europeans | 95.2 /100 | #87 | Exceptional 10.4% |
| Cambodians | 95.0 /100 | #88 | Exceptional 10.4% |
| Immigrants | Denmark | 95.0 /100 | #89 | Exceptional 10.4% |
| Indians (Asian) | 94.9 /100 | #90 | Exceptional 10.4% |
| British | 94.8 /100 | #91 | Exceptional 10.4% |
| Jordanians | 94.4 /100 | #92 | Exceptional 10.4% |
| Australians | 94.4 /100 | #93 | Exceptional 10.4% |
| Immigrants | South Africa | 94.1 /100 | #94 | Exceptional 10.4% |
| Scottish | 94.0 /100 | #95 | Exceptional 10.4% |
| Immigrants | Egypt | 93.7 /100 | #96 | Exceptional 10.4% |
| Romanians | 93.6 /100 | #97 | Exceptional 10.5% |