Immigrants from Moldova vs Indian (Asian) Male Poverty

COMPARE

Immigrants from Moldova
Race
Ancestry
AfghanAfricanAlaska NativeAlaskan AthabascanAlbanianAleutAlsatianAmericanApacheArabArapahoArgentineanArmenianAssyrian/Chaldean/SyriacAustralianAustrianBahamianBangladeshiBarbadianBasqueBelgianBelizeanBermudanBhutaneseBlackfeetBolivianBrazilianBritishBritish West IndianBulgarianBurmeseCajunCambodianCanadianCape VerdeanCarpatho RusynCelticCentral AmericanCentral American IndianCherokeeCheyenneChickasawChileanChineseChippewaChoctawColombianColvilleComancheCosta RicanCreeCreekCroatianCrowCubanCypriotCzechCzechoslovakianDanishDelawareDominicanDutchDutch West IndianEastern EuropeanEcuadorianEgyptianEnglishEstonianEthiopianEuropeanFijianFilipinoFinnishFrenchFrench American IndianFrench CanadianGermanGerman RussianGhanaianGreekGuamanian/ChamorroGuatemalanGuyaneseHaitianHmongHonduranHopiHoumaHungarianIcelanderIndonesianInupiatIranianIraqiIrishIroquoisIsraeliItalianJamaicanJapaneseJordanianKenyanKiowaKoreanLaotianLatvianLebaneseLiberianLithuanianLumbeeLuxembourgerMacedonianMalaysianMalteseMarshalleseMenomineeMexicanMexican American IndianMongolianMoroccanNative HawaiianNavajoNepaleseNew ZealanderNicaraguanNigerianNorthern EuropeanNorwegianOkinawanOsageOttawaPaiutePakistaniPalestinianPanamanianParaguayanPennsylvania GermanPeruvianPimaPolishPortuguesePotawatomiPuebloPuerto RicanPuget Sound SalishRomanianRussianSalvadoranSamoanScandinavianScotch-IrishScottishSeminoleSenegaleseSerbianShoshoneSierra LeoneanSiouxSlavicSlovakSloveneSomaliSouth AfricanSouth AmericanSouth American IndianSoviet UnionSpaniardSpanishSpanish AmericanSpanish American IndianSri LankanSubsaharan AfricanSudaneseSwedishSwissSyrianTaiwaneseThaiTlingit-HaidaTohono O'OdhamTonganTrinidadian and TobagonianTsimshianTurkishU.S. Virgin IslanderUgandanUkrainianUruguayanUteVenezuelanVietnameseWelshWest IndianYakamaYaquiYugoslavianYumanYup'ikZimbabwean
Immigration
NonimmigrantsImmigrantsAfghanistanAfricaAlbaniaArgentinaArmeniaAsiaAustraliaAustriaBahamasBangladeshBarbadosBelarusBelgiumBelizeBoliviaBosnia and HerzegovinaBrazilBulgariaBurma/MyanmarCabo VerdeCambodiaCameroonCanadaCaribbeanCentral AmericaChileChinaColombiaCongoCosta RicaCroatiaCubaCzechoslovakiaDenmarkDominicaDominican RepublicEastern AfricaEastern AsiaEastern EuropeEcuadorEgyptEl SalvadorEnglandEritreaEthiopiaEuropeFijiFranceGermanyGhanaGreeceGrenadaGuatemalaGuyanaHaitiHondurasHong KongHungaryIndiaIndonesiaIranIraqIrelandIsraelItalyJamaicaJapanJordanKazakhstanKenyaKoreaKuwaitLaosLatin AmericaLatviaLebanonLiberiaLithuaniaMalaysiaMexicoMicronesiaMiddle AfricaMoldovaMoroccoNepalNetherlandsNicaraguaNigeriaNorth AmericaNorth MacedoniaNorthern AfricaNorthern EuropeNorwayOceaniaPakistanPanamaPeruPhilippinesPolandPortugalRomaniaRussiaSaudi ArabiaScotlandSenegalSerbiaSierra LeoneSingaporeSomaliaSouth AfricaSouth AmericaSouth Central AsiaSouth Eastern AsiaSouthern EuropeSpainSri LankaSt. Vincent and the GrenadinesSudanSwedenSwitzerlandSyriaTaiwanThailandTrinidad and TobagoTurkeyUgandaUkraineUruguayUzbekistanVenezuelaVietnamWest IndiesWestern AfricaWestern AsiaWestern EuropeYemenZaireZimbabweAzores
Indian (Asian)
Race
Ancestry
AfghanAfricanAlaska NativeAlaskan AthabascanAlbanianAleutAlsatianAmericanApacheArabArapahoArgentineanArmenianAssyrian/Chaldean/SyriacAustralianAustrianBahamianBangladeshiBarbadianBasqueBelgianBelizeanBermudanBhutaneseBlackfeetBolivianBrazilianBritishBritish West IndianBulgarianBurmeseCajunCambodianCanadianCape VerdeanCarpatho RusynCelticCentral AmericanCentral American IndianCherokeeCheyenneChickasawChileanChineseChippewaChoctawColombianColvilleComancheCosta RicanCreeCreekCroatianCrowCubanCypriotCzechCzechoslovakianDanishDelawareDominicanDutchDutch West IndianEastern EuropeanEcuadorianEgyptianEnglishEstonianEthiopianEuropeanFijianFilipinoFinnishFrenchFrench American IndianFrench CanadianGermanGerman RussianGhanaianGreekGuamanian/ChamorroGuatemalanGuyaneseHaitianHmongHonduranHopiHoumaHungarianIcelanderIndian (Asian)IndonesianInupiatIranianIraqiIrishIroquoisIsraeliItalianJamaicanJapaneseJordanianKenyanKiowaKoreanLaotianLatvianLebaneseLiberianLithuanianLumbeeLuxembourgerMacedonianMalaysianMalteseMarshalleseMenomineeMexicanMexican American IndianMongolianMoroccanNative HawaiianNavajoNepaleseNew ZealanderNicaraguanNigerianNorthern EuropeanNorwegianOkinawanOsageOttawaPaiutePakistaniPalestinianPanamanianParaguayanPennsylvania GermanPeruvianPimaPolishPortuguesePotawatomiPuebloPuerto RicanPuget Sound SalishRomanianRussianSalvadoranSamoanScandinavianScotch-IrishScottishSeminoleSenegaleseSerbianShoshoneSierra LeoneanSiouxSlavicSlovakSloveneSomaliSouth AfricanSouth AmericanSouth American IndianSoviet UnionSpaniardSpanishSpanish AmericanSpanish American IndianSri LankanSubsaharan AfricanSudaneseSwedishSwissSyrianTaiwaneseThaiTlingit-HaidaTohono O'OdhamTonganTrinidadian and TobagonianTsimshianTurkishU.S. Virgin IslanderUgandanUkrainianUruguayanUteVenezuelanVietnameseWelshWest IndianYakamaYaquiYugoslavianYumanYup'ikZimbabwean
Immigration
NonimmigrantsImmigrantsAfghanistanAfricaAlbaniaArgentinaArmeniaAsiaAustraliaAustriaBahamasBangladeshBarbadosBelarusBelgiumBelizeBoliviaBosnia and HerzegovinaBrazilBulgariaBurma/MyanmarCabo VerdeCambodiaCameroonCanadaCaribbeanCentral AmericaChileChinaColombiaCongoCosta RicaCroatiaCubaCzechoslovakiaDenmarkDominicaDominican RepublicEastern AfricaEastern AsiaEastern EuropeEcuadorEgyptEl SalvadorEnglandEritreaEthiopiaEuropeFijiFranceGermanyGhanaGreeceGrenadaGuatemalaGuyanaHaitiHondurasHong KongHungaryIndiaIndonesiaIranIraqIrelandIsraelItalyJamaicaJapanJordanKazakhstanKenyaKoreaKuwaitLaosLatin AmericaLatviaLebanonLiberiaLithuaniaMalaysiaMexicoMicronesiaMiddle AfricaMoroccoNepalNetherlandsNicaraguaNigeriaNorth AmericaNorth MacedoniaNorthern AfricaNorthern EuropeNorwayOceaniaPakistanPanamaPeruPhilippinesPolandPortugalRomaniaRussiaSaudi ArabiaScotlandSenegalSerbiaSierra LeoneSingaporeSomaliaSouth AfricaSouth AmericaSouth Central AsiaSouth Eastern AsiaSouthern EuropeSpainSri LankaSt. Vincent and the GrenadinesSudanSwedenSwitzerlandSyriaTaiwanThailandTrinidad and TobagoTurkeyUgandaUkraineUruguayUzbekistanVenezuelaVietnamWest IndiesWestern AfricaWestern AsiaWestern EuropeYemenZaireZimbabweAzores
Male Poverty
Income
Poverty
Unemployment
Labor Participation
Family Structure
Vehicle Availability
Education Level
Disability

Male Poverty Comparison

Immigrants from Moldova

Indians (Asian)

Exceptional
Exceptional
9.9%
MALE POVERTY
99.0/ 100
METRIC RATING
43rd/ 347
METRIC RANK
10.4%
MALE POVERTY
94.9/ 100
METRIC RATING
90th/ 347
METRIC RANK

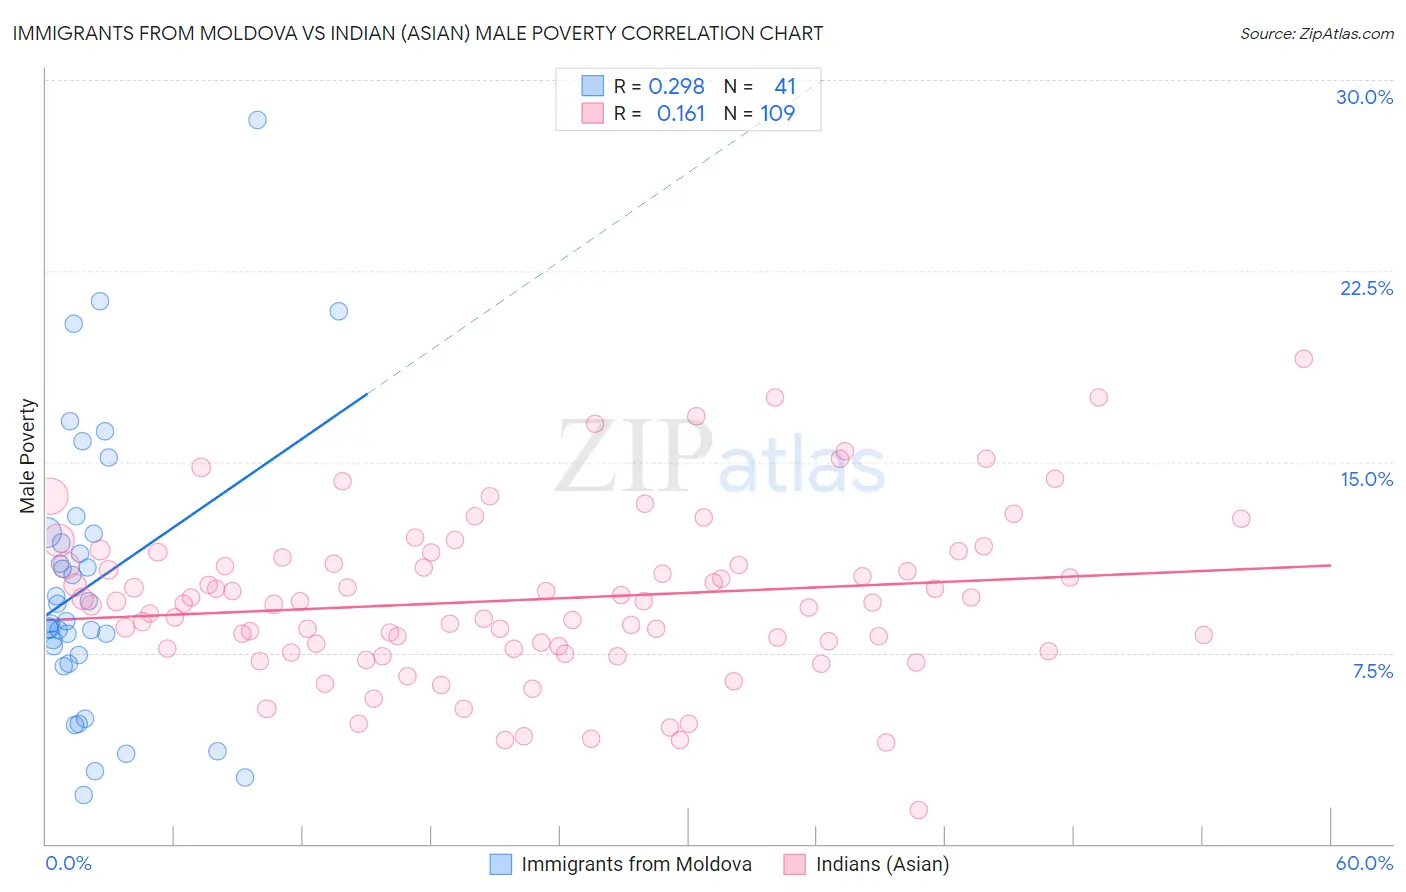
Immigrants from Moldova vs Indian (Asian) Male Poverty Correlation Chart

The statistical analysis conducted on geographies consisting of 124,352,223 people shows a weak positive correlation between the proportion of Immigrants from Moldova and poverty level among males in the United States with a correlation coefficient (R) of 0.298 and weighted average of 9.9%. Similarly, the statistical analysis conducted on geographies consisting of 494,421,628 people shows a poor positive correlation between the proportion of Indians (Asian) and poverty level among males in the United States with a correlation coefficient (R) of 0.161 and weighted average of 10.4%, a difference of 4.7%.
Immigrants from Moldova vs Indian (Asian) Male Poverty

Male Poverty Correlation Summary

MeasurementImmigrants from MoldovaIndian (Asian)
Minimum1.9%1.3%
Maximum28.4%19.1%
Range26.5%17.7%
Mean10.3%9.6%
Median8.8%9.5%
Interquartile 25% (IQ1)7.2%7.7%
Interquartile 75% (IQ3)12.2%11.1%
Interquartile Range (IQR)5.0%3.5%
Standard Deviation (Sample)5.6%3.2%
Standard Deviation (Population)5.5%3.2%

Similar Demographics by Male Poverty

Demographics Similar to Immigrants from Moldova by Male Poverty

In terms of male poverty, the demographic groups most similar to Immigrants from Moldova are Immigrants from Romania (9.9%, a difference of 0.22%), Immigrants from Iran (9.9%, a difference of 0.26%), Immigrants from Serbia (10.0%, a difference of 0.40%), Turkish (10.0%, a difference of 0.42%), and Korean (9.9%, a difference of 0.50%).
DemographicsRating | RankMale Poverty
Czechs
99.4
/100
|
#36
Exceptional
9.8%
Immigrants | Greece
99.3
/100
|
#37
Exceptional
9.8%
Immigrants | Pakistan
99.2
/100
|
#38
Exceptional
9.9%
Russians
99.2
/100
|
#39
Exceptional
9.9%
Cypriots
99.2
/100
|
#40
Exceptional
9.9%
Koreans
99.2
/100
|
#41
Exceptional
9.9%
Immigrants | Iran
99.1
/100
|
#42
Exceptional
9.9%
Immigrants | Moldova
99.0
/100
|
#43
Exceptional
9.9%
Immigrants | Romania
98.9
/100
|
#44
Exceptional
9.9%
Immigrants | Serbia
98.9
/100
|
#45
Exceptional
10.0%
Turks
98.9
/100
|
#46
Exceptional
10.0%
Immigrants | Singapore
98.8
/100
|
#47
Exceptional
10.0%
Immigrants | Japan
98.8
/100
|
#48
Exceptional
10.0%
Slovenes
98.8
/100
|
#49
Exceptional
10.0%
Immigrants | Philippines
98.7
/100
|
#50
Exceptional
10.0%

Demographics Similar to Indians (Asian) by Male Poverty

In terms of male poverty, the demographic groups most similar to Indians (Asian) are Immigrants from Denmark (10.4%, a difference of 0.020%), Cambodian (10.4%, a difference of 0.030%), British (10.4%, a difference of 0.070%), Northern European (10.4%, a difference of 0.17%), and Immigrants from Eastern Asia (10.4%, a difference of 0.20%).
DemographicsRating | RankMale Poverty
Immigrants | Sweden
95.7
/100
|
#83
Exceptional
10.3%
Czechoslovakians
95.6
/100
|
#84
Exceptional
10.3%
Immigrants | England
95.5
/100
|
#85
Exceptional
10.4%
Immigrants | Eastern Asia
95.3
/100
|
#86
Exceptional
10.4%
Northern Europeans
95.2
/100
|
#87
Exceptional
10.4%
Cambodians
95.0
/100
|
#88
Exceptional
10.4%
Immigrants | Denmark
95.0
/100
|
#89
Exceptional
10.4%
Indians (Asian)
94.9
/100
|
#90
Exceptional
10.4%
British
94.8
/100
|
#91
Exceptional
10.4%
Jordanians
94.4
/100
|
#92
Exceptional
10.4%
Australians
94.4
/100
|
#93
Exceptional
10.4%
Immigrants | South Africa
94.1
/100
|
#94
Exceptional
10.4%
Scottish
94.0
/100
|
#95
Exceptional
10.4%
Immigrants | Egypt
93.7
/100
|
#96
Exceptional
10.4%
Romanians
93.6
/100
|
#97
Exceptional
10.5%