Immigrants from Taiwan vs Somali Female Poverty
COMPARE
Immigrants from Taiwan
Somali
Female Poverty
Female Poverty Comparison
Immigrants from Taiwan
Somalis
10.5%
FEMALE POVERTY
100.0/ 100
METRIC RATING
4th/ 347
METRIC RANK
16.6%
FEMALE POVERTY
0.0/ 100
METRIC RATING
298th/ 347
METRIC RANK
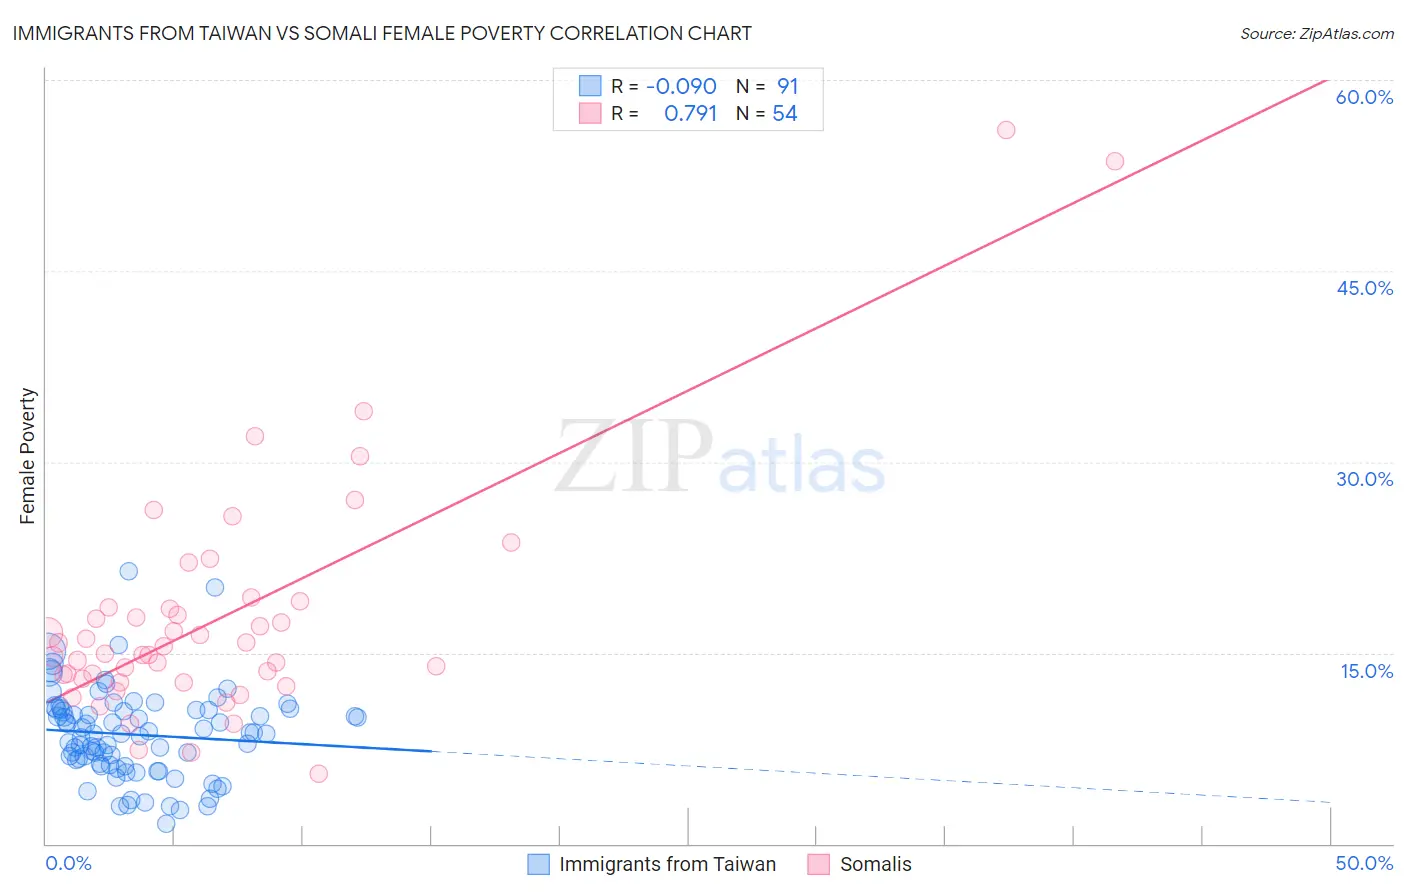
Immigrants from Taiwan vs Somali Female Poverty Correlation Chart
The statistical analysis conducted on geographies consisting of 298,090,597 people shows a slight negative correlation between the proportion of Immigrants from Taiwan and poverty level among females in the United States with a correlation coefficient (R) of -0.090 and weighted average of 10.5%. Similarly, the statistical analysis conducted on geographies consisting of 99,282,230 people shows a strong positive correlation between the proportion of Somalis and poverty level among females in the United States with a correlation coefficient (R) of 0.791 and weighted average of 16.6%, a difference of 57.1%.
Female Poverty Correlation Summary
| Measurement | Immigrants from Taiwan | Somali |
| Minimum | 1.5% | 5.5% |
| Maximum | 21.4% | 56.1% |
| Range | 19.9% | 50.6% |
| Mean | 8.6% | 17.8% |
| Median | 8.6% | 15.2% |
| Interquartile 25% (IQ1) | 6.2% | 13.0% |
| Interquartile 75% (IQ3) | 10.5% | 18.6% |
| Interquartile Range (IQR) | 4.4% | 5.6% |
| Standard Deviation (Sample) | 3.5% | 9.4% |
| Standard Deviation (Population) | 3.5% | 9.3% |
Similar Demographics by Female Poverty
Demographics Similar to Immigrants from Taiwan by Female Poverty
In terms of female poverty, the demographic groups most similar to Immigrants from Taiwan are Thai (10.5%, a difference of 0.76%), Chinese (10.4%, a difference of 1.4%), Filipino (10.9%, a difference of 3.9%), Immigrants from Ireland (11.0%, a difference of 4.3%), and Assyrian/Chaldean/Syriac (11.0%, a difference of 4.7%).
| Demographics | Rating | Rank | Female Poverty |
| Immigrants | India | 100.0 /100 | #1 | Exceptional 9.9% |
| Chinese | 100.0 /100 | #2 | Exceptional 10.4% |
| Thais | 100.0 /100 | #3 | Exceptional 10.5% |
| Immigrants | Taiwan | 100.0 /100 | #4 | Exceptional 10.5% |
| Filipinos | 100.0 /100 | #5 | Exceptional 10.9% |
| Immigrants | Ireland | 99.9 /100 | #6 | Exceptional 11.0% |
| Assyrians/Chaldeans/Syriacs | 99.9 /100 | #7 | Exceptional 11.0% |
| Immigrants | South Central Asia | 99.9 /100 | #8 | Exceptional 11.1% |
| Bulgarians | 99.9 /100 | #9 | Exceptional 11.1% |
| Immigrants | Hong Kong | 99.9 /100 | #10 | Exceptional 11.2% |
| Maltese | 99.9 /100 | #11 | Exceptional 11.2% |
| Bhutanese | 99.9 /100 | #12 | Exceptional 11.3% |
| Immigrants | Lithuania | 99.9 /100 | #13 | Exceptional 11.3% |
| Lithuanians | 99.8 /100 | #14 | Exceptional 11.4% |
| Latvians | 99.8 /100 | #15 | Exceptional 11.4% |
Demographics Similar to Somalis by Female Poverty
In terms of female poverty, the demographic groups most similar to Somalis are Mexican (16.5%, a difference of 0.20%), Hispanic or Latino (16.6%, a difference of 0.52%), Bahamian (16.6%, a difference of 0.56%), Immigrants from Senegal (16.5%, a difference of 0.60%), and Senegalese (16.5%, a difference of 0.62%).
| Demographics | Rating | Rank | Female Poverty |
| Yaqui | 0.0 /100 | #291 | Tragic 16.4% |
| Immigrants | Zaire | 0.0 /100 | #292 | Tragic 16.4% |
| Immigrants | Latin America | 0.0 /100 | #293 | Tragic 16.4% |
| Immigrants | Cabo Verde | 0.0 /100 | #294 | Tragic 16.4% |
| Senegalese | 0.0 /100 | #295 | Tragic 16.5% |
| Immigrants | Senegal | 0.0 /100 | #296 | Tragic 16.5% |
| Mexicans | 0.0 /100 | #297 | Tragic 16.5% |
| Somalis | 0.0 /100 | #298 | Tragic 16.6% |
| Hispanics or Latinos | 0.0 /100 | #299 | Tragic 16.6% |
| Bahamians | 0.0 /100 | #300 | Tragic 16.6% |
| Guatemalans | 0.0 /100 | #301 | Tragic 16.7% |
| Chippewa | 0.0 /100 | #302 | Tragic 16.7% |
| Choctaw | 0.0 /100 | #303 | Tragic 16.8% |
| Immigrants | Central America | 0.0 /100 | #304 | Tragic 16.8% |
| Immigrants | Grenada | 0.0 /100 | #305 | Tragic 16.8% |