Immigrants from Sweden vs Guamanian/Chamorro Female Poverty Among 18-24 Year Olds
COMPARE
Immigrants from Sweden
Guamanian/Chamorro
Female Poverty Among 18-24 Year Olds
Female Poverty Among 18-24 Year Olds Comparison
Immigrants from Sweden
Guamanians/Chamorros
20.7%
FEMALE POVERTY AMONG 18-24 YEAR OLDS
6.8/ 100
METRIC RATING
227th/ 347
METRIC RANK
19.0%
FEMALE POVERTY AMONG 18-24 YEAR OLDS
98.8/ 100
METRIC RATING
95th/ 347
METRIC RANK
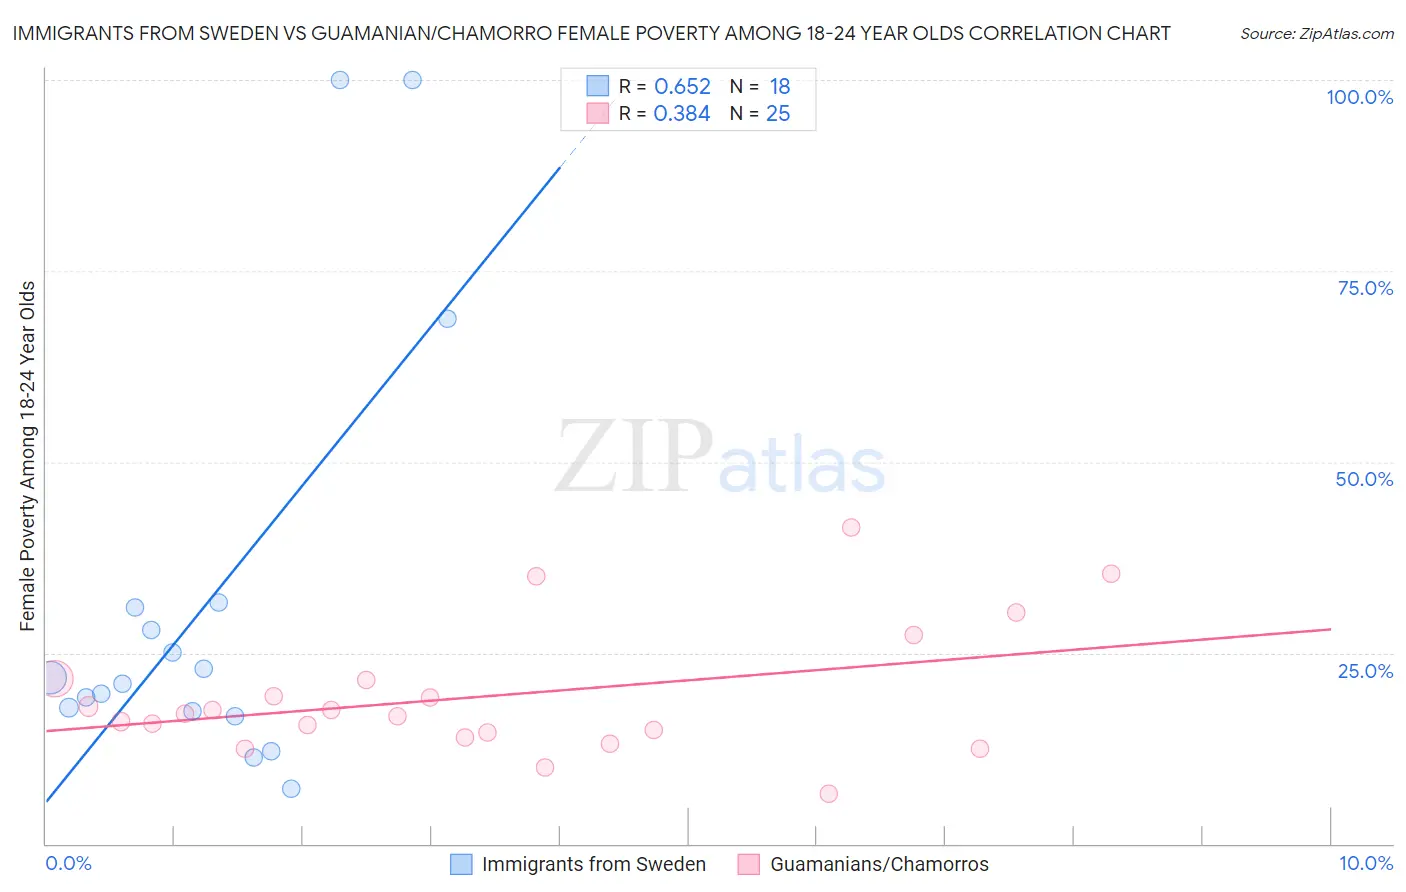
Immigrants from Sweden vs Guamanian/Chamorro Female Poverty Among 18-24 Year Olds Correlation Chart
The statistical analysis conducted on geographies consisting of 162,147,653 people shows a significant positive correlation between the proportion of Immigrants from Sweden and poverty level among females between the ages 18 and 24 in the United States with a correlation coefficient (R) of 0.652 and weighted average of 20.7%. Similarly, the statistical analysis conducted on geographies consisting of 219,657,100 people shows a mild positive correlation between the proportion of Guamanians/Chamorros and poverty level among females between the ages 18 and 24 in the United States with a correlation coefficient (R) of 0.384 and weighted average of 19.0%, a difference of 9.0%.
Female Poverty Among 18-24 Year Olds Correlation Summary
| Measurement | Immigrants from Sweden | Guamanian/Chamorro |
| Minimum | 7.1% | 6.5% |
| Maximum | 100.0% | 41.5% |
| Range | 92.9% | 34.9% |
| Mean | 31.7% | 19.3% |
| Median | 21.3% | 17.0% |
| Interquartile 25% (IQ1) | 17.3% | 14.3% |
| Interquartile 75% (IQ3) | 30.9% | 21.5% |
| Interquartile Range (IQR) | 13.5% | 7.2% |
| Standard Deviation (Sample) | 28.1% | 8.4% |
| Standard Deviation (Population) | 27.3% | 8.3% |
Similar Demographics by Female Poverty Among 18-24 Year Olds
Demographics Similar to Immigrants from Sweden by Female Poverty Among 18-24 Year Olds
In terms of female poverty among 18-24 year olds, the demographic groups most similar to Immigrants from Sweden are Ghanaian (20.8%, a difference of 0.060%), Estonian (20.7%, a difference of 0.070%), Norwegian (20.7%, a difference of 0.080%), Australian (20.8%, a difference of 0.13%), and White/Caucasian (20.8%, a difference of 0.13%).
| Demographics | Rating | Rank | Female Poverty Among 18-24 Year Olds |
| British | 9.4 /100 | #220 | Tragic 20.7% |
| Barbadians | 9.0 /100 | #221 | Tragic 20.7% |
| Guatemalans | 8.1 /100 | #222 | Tragic 20.7% |
| French | 7.9 /100 | #223 | Tragic 20.7% |
| Immigrants | Liberia | 7.6 /100 | #224 | Tragic 20.7% |
| Norwegians | 7.3 /100 | #225 | Tragic 20.7% |
| Estonians | 7.2 /100 | #226 | Tragic 20.7% |
| Immigrants | Sweden | 6.8 /100 | #227 | Tragic 20.7% |
| Ghanaians | 6.5 /100 | #228 | Tragic 20.8% |
| Australians | 6.1 /100 | #229 | Tragic 20.8% |
| Whites/Caucasians | 6.1 /100 | #230 | Tragic 20.8% |
| Immigrants | St. Vincent and the Grenadines | 6.0 /100 | #231 | Tragic 20.8% |
| Finns | 6.0 /100 | #232 | Tragic 20.8% |
| Immigrants | Denmark | 5.8 /100 | #233 | Tragic 20.8% |
| Welsh | 5.4 /100 | #234 | Tragic 20.8% |
Demographics Similar to Guamanians/Chamorros by Female Poverty Among 18-24 Year Olds
In terms of female poverty among 18-24 year olds, the demographic groups most similar to Guamanians/Chamorros are Ukrainian (19.0%, a difference of 0.070%), Sierra Leonean (19.0%, a difference of 0.10%), Haitian (19.0%, a difference of 0.13%), Filipino (19.0%, a difference of 0.16%), and Romanian (19.0%, a difference of 0.20%).
| Demographics | Rating | Rank | Female Poverty Among 18-24 Year Olds |
| Croatians | 99.1 /100 | #88 | Exceptional 19.0% |
| Immigrants | Cabo Verde | 99.0 /100 | #89 | Exceptional 19.0% |
| Afghans | 99.0 /100 | #90 | Exceptional 19.0% |
| Romanians | 98.9 /100 | #91 | Exceptional 19.0% |
| Filipinos | 98.9 /100 | #92 | Exceptional 19.0% |
| Haitians | 98.9 /100 | #93 | Exceptional 19.0% |
| Ukrainians | 98.8 /100 | #94 | Exceptional 19.0% |
| Guamanians/Chamorros | 98.8 /100 | #95 | Exceptional 19.0% |
| Sierra Leoneans | 98.7 /100 | #96 | Exceptional 19.0% |
| Salvadorans | 98.4 /100 | #97 | Exceptional 19.1% |
| Immigrants | Jordan | 98.4 /100 | #98 | Exceptional 19.1% |
| Immigrants | Czechoslovakia | 98.3 /100 | #99 | Exceptional 19.1% |
| Chileans | 98.3 /100 | #100 | Exceptional 19.1% |
| Ecuadorians | 98.1 /100 | #101 | Exceptional 19.1% |
| Immigrants | Caribbean | 98.1 /100 | #102 | Exceptional 19.1% |