Immigrants from Barbados vs Guamanian/Chamorro Female Poverty Among 18-24 Year Olds
COMPARE
Immigrants from Barbados
Guamanian/Chamorro
Female Poverty Among 18-24 Year Olds
Female Poverty Among 18-24 Year Olds Comparison
Immigrants from Barbados
Guamanians/Chamorros
20.2%
FEMALE POVERTY AMONG 18-24 YEAR OLDS
42.8/ 100
METRIC RATING
182nd/ 347
METRIC RANK
19.0%
FEMALE POVERTY AMONG 18-24 YEAR OLDS
98.8/ 100
METRIC RATING
95th/ 347
METRIC RANK
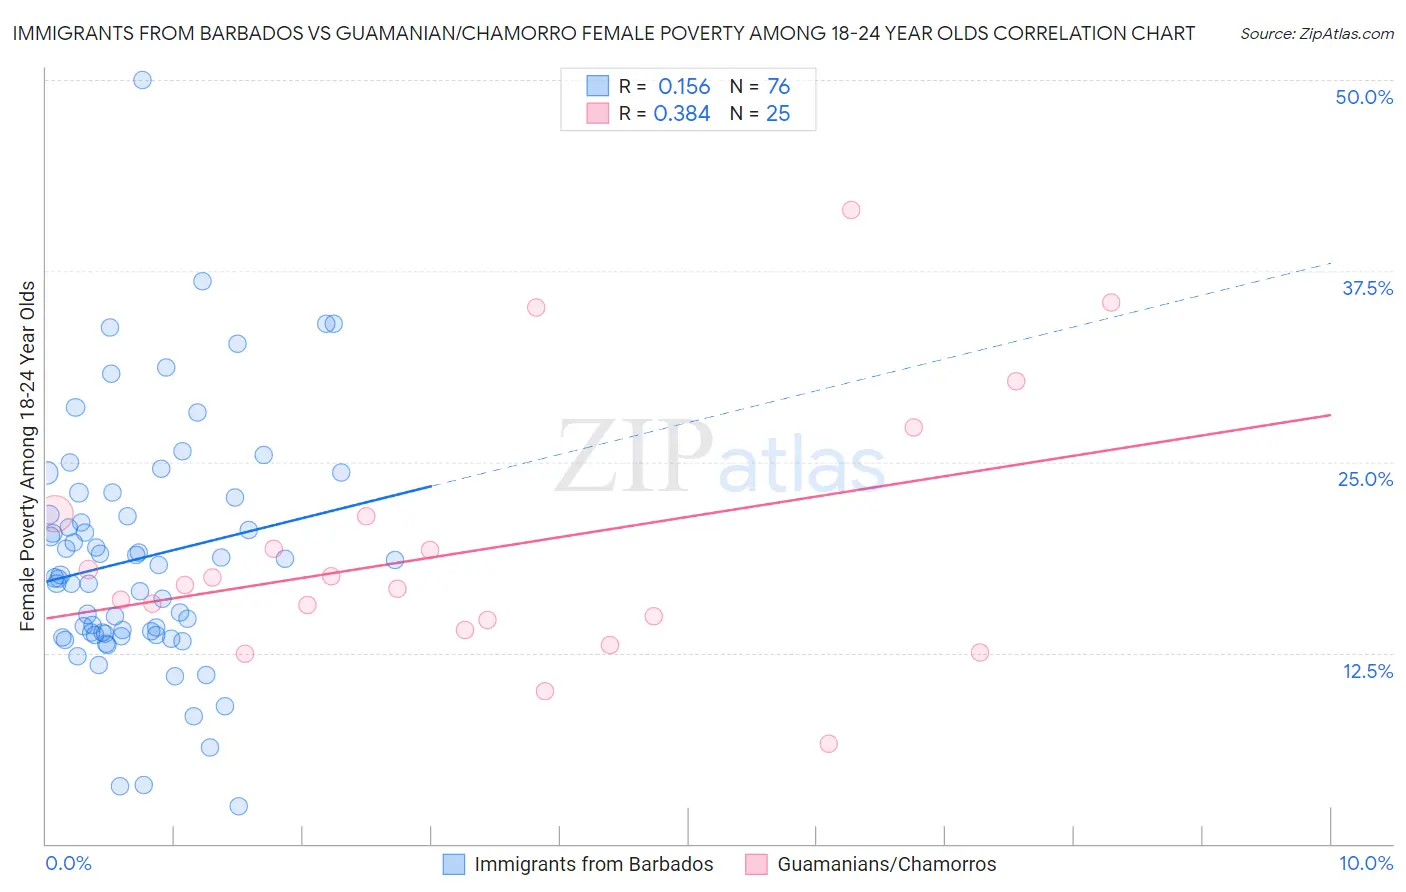
Immigrants from Barbados vs Guamanian/Chamorro Female Poverty Among 18-24 Year Olds Correlation Chart
The statistical analysis conducted on geographies consisting of 112,082,012 people shows a poor positive correlation between the proportion of Immigrants from Barbados and poverty level among females between the ages 18 and 24 in the United States with a correlation coefficient (R) of 0.156 and weighted average of 20.2%. Similarly, the statistical analysis conducted on geographies consisting of 219,657,100 people shows a mild positive correlation between the proportion of Guamanians/Chamorros and poverty level among females between the ages 18 and 24 in the United States with a correlation coefficient (R) of 0.384 and weighted average of 19.0%, a difference of 6.0%.
Female Poverty Among 18-24 Year Olds Correlation Summary
| Measurement | Immigrants from Barbados | Guamanian/Chamorro |
| Minimum | 2.5% | 6.5% |
| Maximum | 50.0% | 41.5% |
| Range | 47.5% | 34.9% |
| Mean | 18.7% | 19.3% |
| Median | 17.5% | 17.0% |
| Interquartile 25% (IQ1) | 13.7% | 14.3% |
| Interquartile 75% (IQ3) | 22.1% | 21.5% |
| Interquartile Range (IQR) | 8.4% | 7.2% |
| Standard Deviation (Sample) | 8.0% | 8.4% |
| Standard Deviation (Population) | 7.9% | 8.3% |
Similar Demographics by Female Poverty Among 18-24 Year Olds
Demographics Similar to Immigrants from Barbados by Female Poverty Among 18-24 Year Olds
In terms of female poverty among 18-24 year olds, the demographic groups most similar to Immigrants from Barbados are Immigrants from China (20.2%, a difference of 0.010%), Iraqi (20.2%, a difference of 0.020%), Ethiopian (20.2%, a difference of 0.050%), Immigrants from Kazakhstan (20.2%, a difference of 0.060%), and Swiss (20.2%, a difference of 0.060%).
| Demographics | Rating | Rank | Female Poverty Among 18-24 Year Olds |
| South American Indians | 48.4 /100 | #175 | Average 20.1% |
| Kenyans | 44.9 /100 | #176 | Average 20.2% |
| Immigrants | Kazakhstan | 44.2 /100 | #177 | Average 20.2% |
| Swiss | 44.0 /100 | #178 | Average 20.2% |
| Ethiopians | 43.8 /100 | #179 | Average 20.2% |
| Iraqis | 43.3 /100 | #180 | Average 20.2% |
| Immigrants | China | 43.0 /100 | #181 | Average 20.2% |
| Immigrants | Barbados | 42.8 /100 | #182 | Average 20.2% |
| Lebanese | 40.6 /100 | #183 | Average 20.2% |
| Immigrants | Central America | 39.9 /100 | #184 | Fair 20.2% |
| Nepalese | 39.7 /100 | #185 | Fair 20.2% |
| Immigrants | Ethiopia | 37.3 /100 | #186 | Fair 20.2% |
| Immigrants | Mexico | 36.3 /100 | #187 | Fair 20.2% |
| Scandinavians | 34.6 /100 | #188 | Fair 20.3% |
| Immigrants | Germany | 34.0 /100 | #189 | Fair 20.3% |
Demographics Similar to Guamanians/Chamorros by Female Poverty Among 18-24 Year Olds
In terms of female poverty among 18-24 year olds, the demographic groups most similar to Guamanians/Chamorros are Ukrainian (19.0%, a difference of 0.070%), Sierra Leonean (19.0%, a difference of 0.10%), Haitian (19.0%, a difference of 0.13%), Filipino (19.0%, a difference of 0.16%), and Romanian (19.0%, a difference of 0.20%).
| Demographics | Rating | Rank | Female Poverty Among 18-24 Year Olds |
| Croatians | 99.1 /100 | #88 | Exceptional 19.0% |
| Immigrants | Cabo Verde | 99.0 /100 | #89 | Exceptional 19.0% |
| Afghans | 99.0 /100 | #90 | Exceptional 19.0% |
| Romanians | 98.9 /100 | #91 | Exceptional 19.0% |
| Filipinos | 98.9 /100 | #92 | Exceptional 19.0% |
| Haitians | 98.9 /100 | #93 | Exceptional 19.0% |
| Ukrainians | 98.8 /100 | #94 | Exceptional 19.0% |
| Guamanians/Chamorros | 98.8 /100 | #95 | Exceptional 19.0% |
| Sierra Leoneans | 98.7 /100 | #96 | Exceptional 19.0% |
| Salvadorans | 98.4 /100 | #97 | Exceptional 19.1% |
| Immigrants | Jordan | 98.4 /100 | #98 | Exceptional 19.1% |
| Immigrants | Czechoslovakia | 98.3 /100 | #99 | Exceptional 19.1% |
| Chileans | 98.3 /100 | #100 | Exceptional 19.1% |
| Ecuadorians | 98.1 /100 | #101 | Exceptional 19.1% |
| Immigrants | Caribbean | 98.1 /100 | #102 | Exceptional 19.1% |