Immigrants from Sweden vs Bulgarian Single Female Poverty
COMPARE
Immigrants from Sweden
Bulgarian
Single Female Poverty
Single Female Poverty Comparison
Immigrants from Sweden
Bulgarians
19.4%
SINGLE FEMALE POVERTY
99.2/ 100
METRIC RATING
84th/ 347
METRIC RANK
18.8%
SINGLE FEMALE POVERTY
99.9/ 100
METRIC RATING
39th/ 347
METRIC RANK
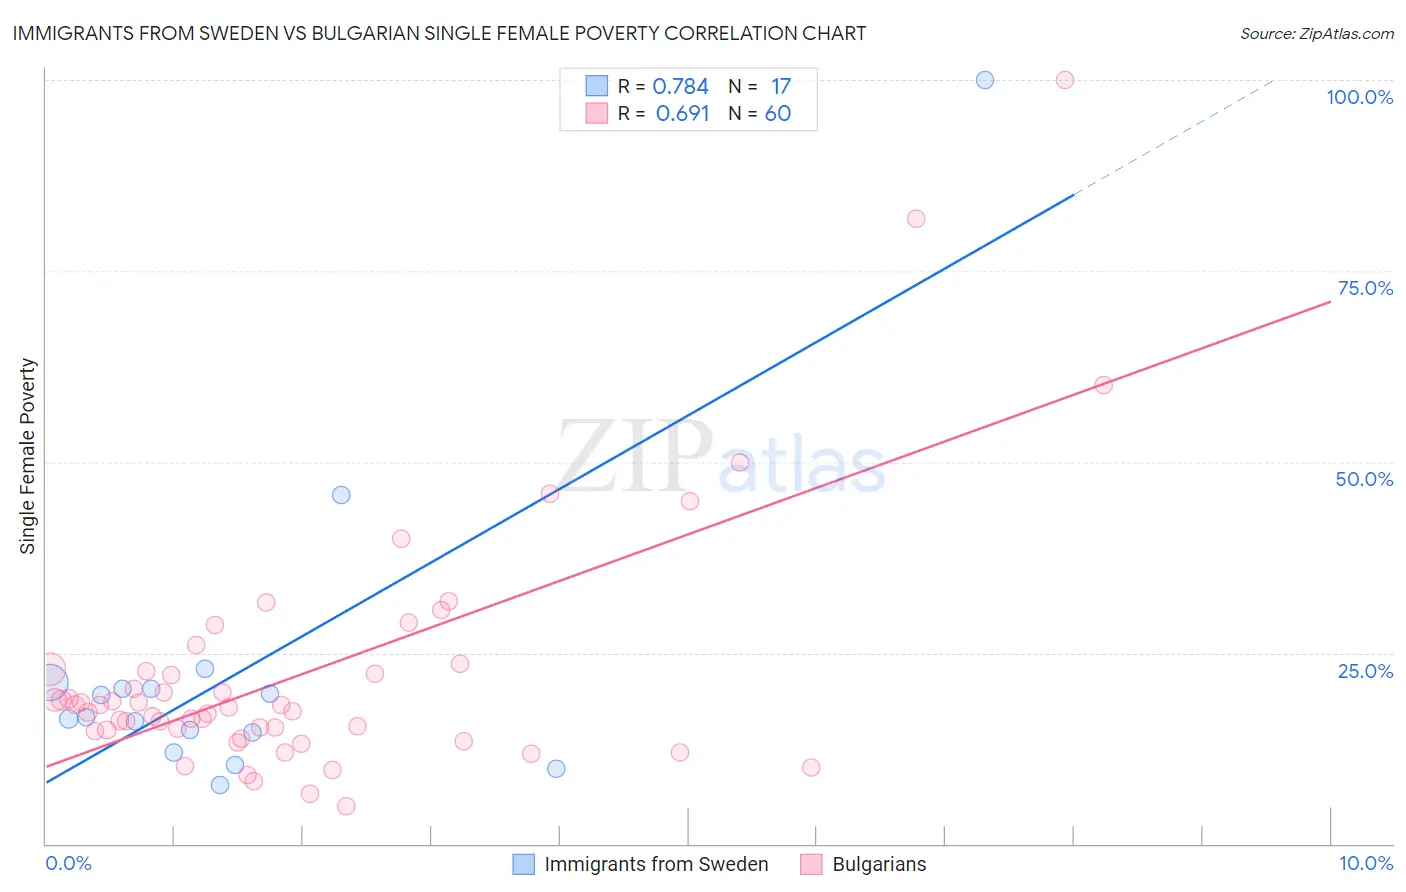
Immigrants from Sweden vs Bulgarian Single Female Poverty Correlation Chart
The statistical analysis conducted on geographies consisting of 163,142,104 people shows a strong positive correlation between the proportion of Immigrants from Sweden and poverty level among single females in the United States with a correlation coefficient (R) of 0.784 and weighted average of 19.4%. Similarly, the statistical analysis conducted on geographies consisting of 203,529,625 people shows a significant positive correlation between the proportion of Bulgarians and poverty level among single females in the United States with a correlation coefficient (R) of 0.691 and weighted average of 18.8%, a difference of 3.4%.
Single Female Poverty Correlation Summary
| Measurement | Immigrants from Sweden | Bulgarian |
| Minimum | 7.8% | 5.0% |
| Maximum | 100.0% | 100.0% |
| Range | 92.2% | 95.0% |
| Mean | 22.8% | 22.4% |
| Median | 16.5% | 18.0% |
| Interquartile 25% (IQ1) | 13.2% | 14.8% |
| Interquartile 75% (IQ3) | 20.7% | 22.7% |
| Interquartile Range (IQR) | 7.5% | 7.9% |
| Standard Deviation (Sample) | 21.6% | 16.6% |
| Standard Deviation (Population) | 20.9% | 16.5% |
Similar Demographics by Single Female Poverty
Demographics Similar to Immigrants from Sweden by Single Female Poverty
In terms of single female poverty, the demographic groups most similar to Immigrants from Sweden are Immigrants from Albania (19.4%, a difference of 0.040%), Greek (19.4%, a difference of 0.040%), Taiwanese (19.4%, a difference of 0.080%), Immigrants from Malaysia (19.4%, a difference of 0.090%), and Immigrants from Scotland (19.4%, a difference of 0.10%).
| Demographics | Rating | Rank | Single Female Poverty |
| Immigrants | Russia | 99.3 /100 | #77 | Exceptional 19.4% |
| Albanians | 99.3 /100 | #78 | Exceptional 19.4% |
| Immigrants | Sierra Leone | 99.3 /100 | #79 | Exceptional 19.4% |
| Immigrants | Australia | 99.3 /100 | #80 | Exceptional 19.4% |
| Immigrants | Scotland | 99.2 /100 | #81 | Exceptional 19.4% |
| Immigrants | Malaysia | 99.2 /100 | #82 | Exceptional 19.4% |
| Taiwanese | 99.2 /100 | #83 | Exceptional 19.4% |
| Immigrants | Sweden | 99.2 /100 | #84 | Exceptional 19.4% |
| Immigrants | Albania | 99.2 /100 | #85 | Exceptional 19.4% |
| Greeks | 99.2 /100 | #86 | Exceptional 19.4% |
| Zimbabweans | 99.0 /100 | #87 | Exceptional 19.5% |
| Afghans | 99.0 /100 | #88 | Exceptional 19.5% |
| Immigrants | Ukraine | 99.0 /100 | #89 | Exceptional 19.5% |
| Immigrants | Lebanon | 98.8 /100 | #90 | Exceptional 19.6% |
| Soviet Union | 98.8 /100 | #91 | Exceptional 19.6% |
Demographics Similar to Bulgarians by Single Female Poverty
In terms of single female poverty, the demographic groups most similar to Bulgarians are Tongan (18.8%, a difference of 0.030%), Okinawan (18.8%, a difference of 0.030%), Immigrants from Serbia (18.8%, a difference of 0.050%), Jordanian (18.8%, a difference of 0.13%), and Immigrants from Romania (18.8%, a difference of 0.28%).
| Demographics | Rating | Rank | Single Female Poverty |
| Immigrants | Sri Lanka | 99.9 /100 | #32 | Exceptional 18.6% |
| Immigrants | Philippines | 99.9 /100 | #33 | Exceptional 18.6% |
| Koreans | 99.9 /100 | #34 | Exceptional 18.6% |
| Immigrants | Japan | 99.9 /100 | #35 | Exceptional 18.6% |
| Turks | 99.9 /100 | #36 | Exceptional 18.7% |
| Immigrants | Armenia | 99.9 /100 | #37 | Exceptional 18.7% |
| Tongans | 99.9 /100 | #38 | Exceptional 18.8% |
| Bulgarians | 99.9 /100 | #39 | Exceptional 18.8% |
| Okinawans | 99.9 /100 | #40 | Exceptional 18.8% |
| Immigrants | Serbia | 99.9 /100 | #41 | Exceptional 18.8% |
| Jordanians | 99.9 /100 | #42 | Exceptional 18.8% |
| Immigrants | Romania | 99.9 /100 | #43 | Exceptional 18.8% |
| Immigrants | Croatia | 99.9 /100 | #44 | Exceptional 18.9% |
| Immigrants | Indonesia | 99.8 /100 | #45 | Exceptional 18.9% |
| Macedonians | 99.8 /100 | #46 | Exceptional 18.9% |