Immigrants from Sri Lanka vs Yakama Poverty
COMPARE
Immigrants from Sri Lanka
Yakama
Poverty
Poverty Comparison
Immigrants from Sri Lanka
Yakama
11.2%
POVERTY
97.9/ 100
METRIC RATING
60th/ 347
METRIC RANK
16.7%
POVERTY
0.0/ 100
METRIC RATING
324th/ 347
METRIC RANK
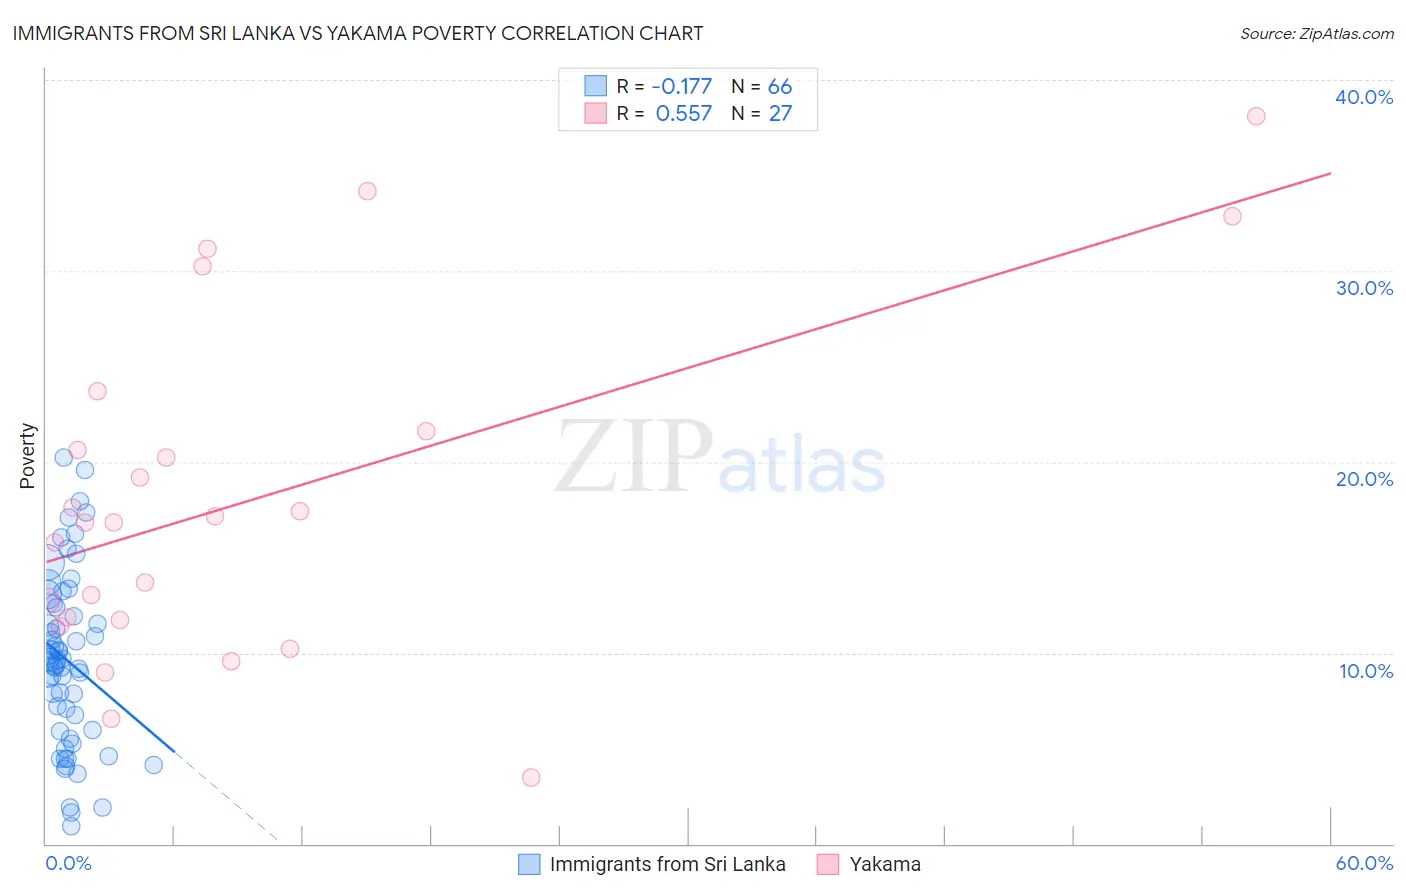
Immigrants from Sri Lanka vs Yakama Poverty Correlation Chart
The statistical analysis conducted on geographies consisting of 149,683,532 people shows a poor negative correlation between the proportion of Immigrants from Sri Lanka and poverty level in the United States with a correlation coefficient (R) of -0.177 and weighted average of 11.2%. Similarly, the statistical analysis conducted on geographies consisting of 19,917,879 people shows a substantial positive correlation between the proportion of Yakama and poverty level in the United States with a correlation coefficient (R) of 0.557 and weighted average of 16.7%, a difference of 49.1%.
Poverty Correlation Summary
| Measurement | Immigrants from Sri Lanka | Yakama |
| Minimum | 0.89% | 3.5% |
| Maximum | 20.2% | 38.1% |
| Range | 19.3% | 34.6% |
| Mean | 9.6% | 18.0% |
| Median | 9.6% | 16.8% |
| Interquartile 25% (IQ1) | 6.0% | 11.7% |
| Interquartile 75% (IQ3) | 12.4% | 21.6% |
| Interquartile Range (IQR) | 6.4% | 9.9% |
| Standard Deviation (Sample) | 4.5% | 8.8% |
| Standard Deviation (Population) | 4.4% | 8.7% |
Similar Demographics by Poverty
Demographics Similar to Immigrants from Sri Lanka by Poverty
In terms of poverty, the demographic groups most similar to Immigrants from Sri Lanka are Immigrants from Italy (11.2%, a difference of 0.060%), Austrian (11.2%, a difference of 0.10%), Ukrainian (11.2%, a difference of 0.10%), Immigrants from Europe (11.2%, a difference of 0.16%), and German (11.1%, a difference of 0.31%).
| Demographics | Rating | Rank | Poverty |
| Immigrants | Austria | 98.6 /100 | #53 | Exceptional 11.1% |
| Immigrants | Bulgaria | 98.5 /100 | #54 | Exceptional 11.1% |
| Immigrants | Serbia | 98.5 /100 | #55 | Exceptional 11.1% |
| Estonians | 98.2 /100 | #56 | Exceptional 11.1% |
| Scandinavians | 98.2 /100 | #57 | Exceptional 11.1% |
| Germans | 98.1 /100 | #58 | Exceptional 11.1% |
| Immigrants | Europe | 98.0 /100 | #59 | Exceptional 11.2% |
| Immigrants | Sri Lanka | 97.9 /100 | #60 | Exceptional 11.2% |
| Immigrants | Italy | 97.9 /100 | #61 | Exceptional 11.2% |
| Austrians | 97.8 /100 | #62 | Exceptional 11.2% |
| Ukrainians | 97.8 /100 | #63 | Exceptional 11.2% |
| Swiss | 97.7 /100 | #64 | Exceptional 11.2% |
| Immigrants | Asia | 97.5 /100 | #65 | Exceptional 11.2% |
| Immigrants | Netherlands | 97.5 /100 | #66 | Exceptional 11.2% |
| Immigrants | Australia | 97.4 /100 | #67 | Exceptional 11.2% |
Demographics Similar to Yakama by Poverty
In terms of poverty, the demographic groups most similar to Yakama are Central American Indian (16.7%, a difference of 0.23%), Paiute (16.7%, a difference of 0.52%), Colville (16.6%, a difference of 0.54%), Kiowa (16.8%, a difference of 1.1%), and Menominee (16.4%, a difference of 1.3%).
| Demographics | Rating | Rank | Poverty |
| U.S. Virgin Islanders | 0.0 /100 | #317 | Tragic 16.1% |
| Immigrants | Dominica | 0.0 /100 | #318 | Tragic 16.1% |
| Immigrants | Congo | 0.0 /100 | #319 | Tragic 16.1% |
| Immigrants | Honduras | 0.0 /100 | #320 | Tragic 16.2% |
| Arapaho | 0.0 /100 | #321 | Tragic 16.3% |
| Menominee | 0.0 /100 | #322 | Tragic 16.4% |
| Colville | 0.0 /100 | #323 | Tragic 16.6% |
| Yakama | 0.0 /100 | #324 | Tragic 16.7% |
| Central American Indians | 0.0 /100 | #325 | Tragic 16.7% |
| Paiute | 0.0 /100 | #326 | Tragic 16.7% |
| Kiowa | 0.0 /100 | #327 | Tragic 16.8% |
| Ute | 0.0 /100 | #328 | Tragic 16.9% |
| Blacks/African Americans | 0.0 /100 | #329 | Tragic 17.3% |
| Dominicans | 0.0 /100 | #330 | Tragic 17.6% |
| Immigrants | Dominican Republic | 0.0 /100 | #331 | Tragic 17.8% |