Immigrants from Sri Lanka vs Immigrants from Bolivia Single Female Poverty

COMPARE

Immigrants from Sri Lanka
Race
Ancestry
AfghanAfricanAlaska NativeAlaskan AthabascanAlbanianAleutAlsatianAmericanApacheArabArapahoArgentineanArmenianAssyrian/Chaldean/SyriacAustralianAustrianBahamianBangladeshiBarbadianBasqueBelgianBelizeanBermudanBhutaneseBlackfeetBolivianBrazilianBritishBritish West IndianBulgarianBurmeseCajunCambodianCanadianCape VerdeanCarpatho RusynCelticCentral AmericanCentral American IndianCherokeeCheyenneChickasawChileanChineseChippewaChoctawColombianColvilleComancheCosta RicanCreeCreekCroatianCrowCubanCypriotCzechCzechoslovakianDanishDelawareDominicanDutchDutch West IndianEastern EuropeanEcuadorianEgyptianEnglishEstonianEthiopianEuropeanFijianFilipinoFinnishFrenchFrench American IndianFrench CanadianGermanGerman RussianGhanaianGreekGuamanian/ChamorroGuatemalanGuyaneseHaitianHmongHonduranHopiHoumaHungarianIcelanderIndian (Asian)IndonesianInupiatIranianIraqiIrishIroquoisIsraeliItalianJamaicanJapaneseJordanianKenyanKiowaKoreanLaotianLatvianLebaneseLiberianLithuanianLumbeeLuxembourgerMacedonianMalaysianMalteseMarshalleseMenomineeMexicanMexican American IndianMongolianMoroccanNative HawaiianNavajoNepaleseNew ZealanderNicaraguanNigerianNorthern EuropeanNorwegianOkinawanOsageOttawaPaiutePakistaniPalestinianPanamanianParaguayanPennsylvania GermanPeruvianPimaPolishPortuguesePotawatomiPuebloPuerto RicanPuget Sound SalishRomanianRussianSalvadoranSamoanScandinavianScotch-IrishScottishSeminoleSenegaleseSerbianShoshoneSierra LeoneanSiouxSlavicSlovakSloveneSomaliSouth AfricanSouth AmericanSouth American IndianSoviet UnionSpaniardSpanishSpanish AmericanSpanish American IndianSri LankanSubsaharan AfricanSudaneseSwedishSwissSyrianTaiwaneseThaiTlingit-HaidaTohono O'OdhamTonganTrinidadian and TobagonianTsimshianTurkishU.S. Virgin IslanderUgandanUkrainianUruguayanUteVenezuelanVietnameseWelshWest IndianYakamaYaquiYugoslavianYumanYup'ikZimbabwean
Immigration
NonimmigrantsImmigrantsAfghanistanAfricaAlbaniaArgentinaArmeniaAsiaAustraliaAustriaBahamasBangladeshBarbadosBelarusBelgiumBelizeBosnia and HerzegovinaBrazilBulgariaBurma/MyanmarCabo VerdeCambodiaCameroonCanadaCaribbeanCentral AmericaChileChinaColombiaCongoCosta RicaCroatiaCubaCzechoslovakiaDenmarkDominicaDominican RepublicEastern AfricaEastern AsiaEastern EuropeEcuadorEgyptEl SalvadorEnglandEritreaEthiopiaEuropeFijiFranceGermanyGhanaGreeceGrenadaGuatemalaGuyanaHaitiHondurasHong KongHungaryIndiaIndonesiaIranIraqIrelandIsraelItalyJamaicaJapanJordanKazakhstanKenyaKoreaKuwaitLaosLatin AmericaLatviaLebanonLiberiaLithuaniaMalaysiaMexicoMicronesiaMiddle AfricaMoldovaMoroccoNepalNetherlandsNicaraguaNigeriaNorth AmericaNorth MacedoniaNorthern AfricaNorthern EuropeNorwayOceaniaPakistanPanamaPeruPhilippinesPolandPortugalRomaniaRussiaSaudi ArabiaScotlandSenegalSerbiaSierra LeoneSingaporeSomaliaSouth AfricaSouth AmericaSouth Central AsiaSouth Eastern AsiaSouthern EuropeSpainSri LankaSt. Vincent and the GrenadinesSudanSwedenSwitzerlandSyriaTaiwanThailandTrinidad and TobagoTurkeyUgandaUkraineUruguayUzbekistanVenezuelaVietnamWest IndiesWestern AfricaWestern AsiaWestern EuropeYemenZaireZimbabweAzores
Immigrants from Bolivia
Race
Ancestry
AfghanAfricanAlaska NativeAlaskan AthabascanAlbanianAleutAlsatianAmericanApacheArabArapahoArgentineanArmenianAssyrian/Chaldean/SyriacAustralianAustrianBahamianBangladeshiBarbadianBasqueBelgianBelizeanBermudanBhutaneseBlackfeetBolivianBrazilianBritishBritish West IndianBulgarianBurmeseCajunCambodianCanadianCape VerdeanCarpatho RusynCelticCentral AmericanCentral American IndianCherokeeCheyenneChickasawChileanChineseChippewaChoctawColombianColvilleComancheCosta RicanCreeCreekCroatianCrowCubanCypriotCzechCzechoslovakianDanishDelawareDominicanDutchDutch West IndianEastern EuropeanEcuadorianEgyptianEnglishEstonianEthiopianEuropeanFijianFilipinoFinnishFrenchFrench American IndianFrench CanadianGermanGerman RussianGhanaianGreekGuamanian/ChamorroGuatemalanGuyaneseHaitianHmongHonduranHopiHoumaHungarianIcelanderIndian (Asian)IndonesianInupiatIranianIraqiIrishIroquoisIsraeliItalianJamaicanJapaneseJordanianKenyanKiowaKoreanLaotianLatvianLebaneseLiberianLithuanianLumbeeLuxembourgerMacedonianMalaysianMalteseMarshalleseMenomineeMexicanMexican American IndianMongolianMoroccanNative HawaiianNavajoNepaleseNew ZealanderNicaraguanNigerianNorthern EuropeanNorwegianOkinawanOsageOttawaPaiutePakistaniPalestinianPanamanianParaguayanPennsylvania GermanPeruvianPimaPolishPortuguesePotawatomiPuebloPuerto RicanPuget Sound SalishRomanianRussianSalvadoranSamoanScandinavianScotch-IrishScottishSeminoleSenegaleseSerbianShoshoneSierra LeoneanSiouxSlavicSlovakSloveneSomaliSouth AfricanSouth AmericanSouth American IndianSoviet UnionSpaniardSpanishSpanish AmericanSpanish American IndianSri LankanSubsaharan AfricanSudaneseSwedishSwissSyrianTaiwaneseThaiTlingit-HaidaTohono O'OdhamTonganTrinidadian and TobagonianTsimshianTurkishU.S. Virgin IslanderUgandanUkrainianUruguayanUteVenezuelanVietnameseWelshWest IndianYakamaYaquiYugoslavianYumanYup'ikZimbabwean
Immigration
NonimmigrantsImmigrantsAfghanistanAfricaAlbaniaArgentinaArmeniaAsiaAustraliaAustriaBahamasBangladeshBarbadosBelarusBelgiumBelizeBoliviaBosnia and HerzegovinaBrazilBulgariaBurma/MyanmarCabo VerdeCambodiaCameroonCanadaCaribbeanCentral AmericaChileChinaColombiaCongoCosta RicaCroatiaCubaCzechoslovakiaDenmarkDominicaDominican RepublicEastern AfricaEastern AsiaEastern EuropeEcuadorEgyptEl SalvadorEnglandEritreaEthiopiaEuropeFijiFranceGermanyGhanaGreeceGrenadaGuatemalaGuyanaHaitiHondurasHong KongHungaryIndiaIndonesiaIranIraqIrelandIsraelItalyJamaicaJapanJordanKazakhstanKenyaKoreaKuwaitLaosLatin AmericaLatviaLebanonLiberiaLithuaniaMalaysiaMexicoMicronesiaMiddle AfricaMoldovaMoroccoNepalNetherlandsNicaraguaNigeriaNorth AmericaNorth MacedoniaNorthern AfricaNorthern EuropeNorwayOceaniaPakistanPanamaPeruPhilippinesPolandPortugalRomaniaRussiaSaudi ArabiaScotlandSenegalSerbiaSierra LeoneSingaporeSomaliaSouth AfricaSouth AmericaSouth Central AsiaSouth Eastern AsiaSouthern EuropeSpainSt. Vincent and the GrenadinesSudanSwedenSwitzerlandSyriaTaiwanThailandTrinidad and TobagoTurkeyUgandaUkraineUruguayUzbekistanVenezuelaVietnamWest IndiesWestern AfricaWestern AsiaWestern EuropeYemenZaireZimbabweAzores
Single Female Poverty
Income
Poverty
Unemployment
Labor Participation
Family Structure
Vehicle Availability
Education Level
Disability

Single Female Poverty Comparison

Immigrants from Sri Lanka

Immigrants from Bolivia

Exceptional
Exceptional
18.6%
SINGLE FEMALE POVERTY
99.9/ 100
METRIC RATING
32nd/ 347
METRIC RANK
17.8%
SINGLE FEMALE POVERTY
100.0/ 100
METRIC RATING
13th/ 347
METRIC RANK

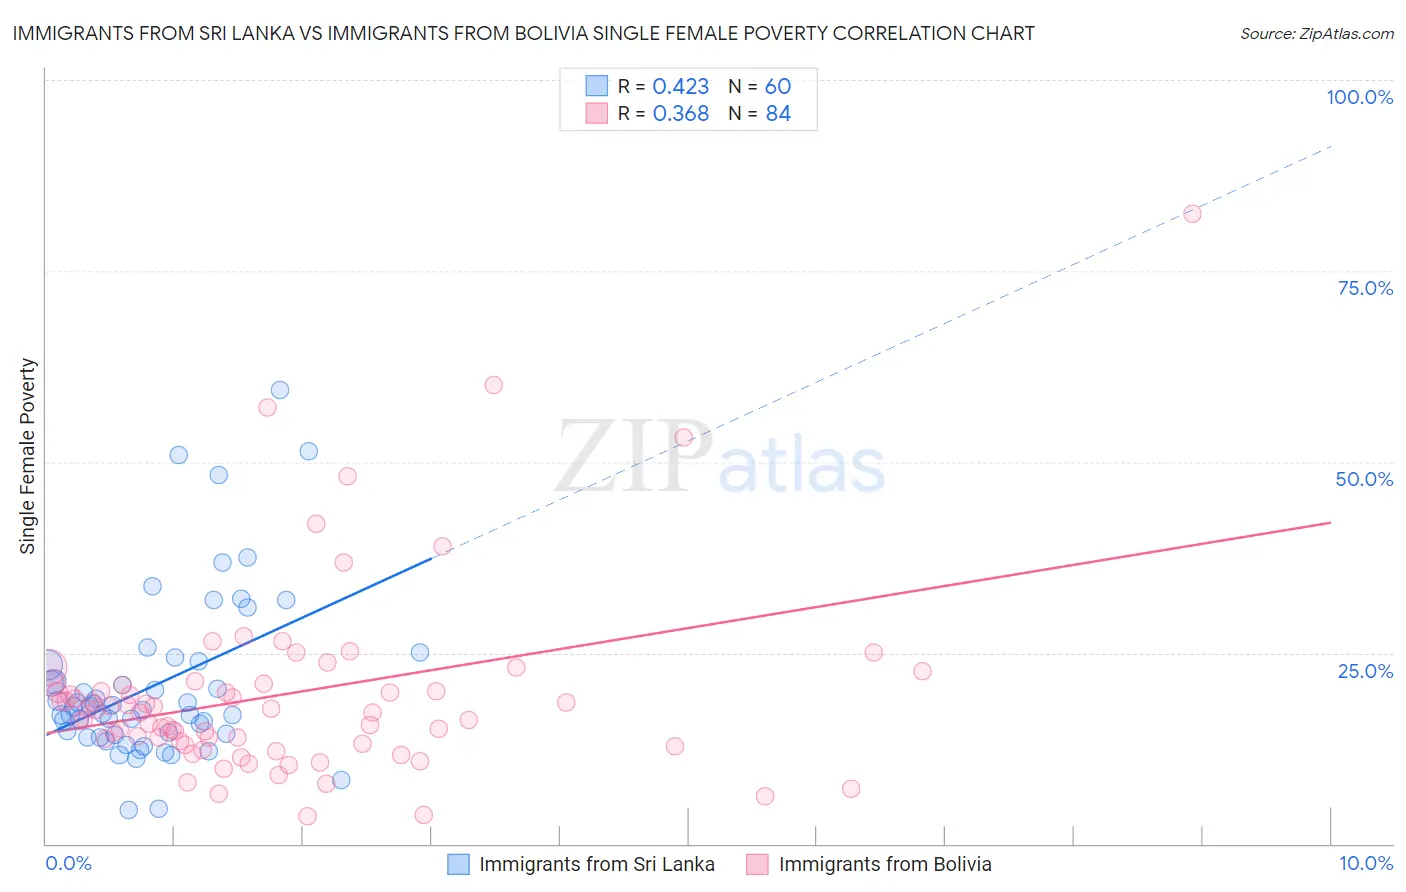
Immigrants from Sri Lanka vs Immigrants from Bolivia Single Female Poverty Correlation Chart

The statistical analysis conducted on geographies consisting of 148,613,920 people shows a moderate positive correlation between the proportion of Immigrants from Sri Lanka and poverty level among single females in the United States with a correlation coefficient (R) of 0.423 and weighted average of 18.6%. Similarly, the statistical analysis conducted on geographies consisting of 157,883,444 people shows a mild positive correlation between the proportion of Immigrants from Bolivia and poverty level among single females in the United States with a correlation coefficient (R) of 0.368 and weighted average of 17.8%, a difference of 4.1%.
Immigrants from Sri Lanka vs Immigrants from Bolivia Single Female Poverty

Single Female Poverty Correlation Summary

MeasurementImmigrants from Sri LankaImmigrants from Bolivia
Minimum4.4%3.6%
Maximum59.4%82.5%
Range55.0%78.9%
Mean20.8%19.6%
Median17.7%17.3%
Interquartile 25% (IQ1)14.4%13.3%
Interquartile 75% (IQ3)23.6%20.9%
Interquartile Range (IQR)9.3%7.6%
Standard Deviation (Sample)11.0%12.6%
Standard Deviation (Population)11.0%12.5%

Demographics Similar to Immigrants from Sri Lanka and Immigrants from Bolivia by Single Female Poverty

In terms of single female poverty, the demographic groups most similar to Immigrants from Sri Lanka are Immigrants from Asia (18.6%, a difference of 0.090%), Immigrants from North Macedonia (18.5%, a difference of 0.14%), Immigrants from Poland (18.5%, a difference of 0.29%), Immigrants from Moldova (18.5%, a difference of 0.39%), and Immigrants from Pakistan (18.4%, a difference of 0.89%). Similarly, the demographic groups most similar to Immigrants from Bolivia are Immigrants from South Central Asia (17.8%, a difference of 0.26%), Bolivian (17.9%, a difference of 0.44%), Indian (Asian) (17.9%, a difference of 0.59%), Iranian (18.0%, a difference of 0.75%), and Immigrants from Korea (18.1%, a difference of 1.3%).
DemographicsRating | RankSingle Female Poverty
Immigrants | South Central Asia
100.0
/100
|
#12
Exceptional
17.8%
Immigrants | Bolivia
100.0
/100
|
#13
Exceptional
17.8%
Bolivians
100.0
/100
|
#14
Exceptional
17.9%
Indians (Asian)
100.0
/100
|
#15
Exceptional
17.9%
Iranians
100.0
/100
|
#16
Exceptional
18.0%
Immigrants | Korea
100.0
/100
|
#17
Exceptional
18.1%
Immigrants | Eastern Asia
100.0
/100
|
#18
Exceptional
18.1%
Immigrants | China
100.0
/100
|
#19
Exceptional
18.1%
Immigrants | Greece
100.0
/100
|
#20
Exceptional
18.3%
Maltese
100.0
/100
|
#21
Exceptional
18.3%
Burmese
100.0
/100
|
#22
Exceptional
18.3%
Asians
100.0
/100
|
#23
Exceptional
18.3%
Armenians
100.0
/100
|
#24
Exceptional
18.3%
Immigrants | Singapore
100.0
/100
|
#25
Exceptional
18.3%
Immigrants | Israel
100.0
/100
|
#26
Exceptional
18.3%
Immigrants | Pakistan
100.0
/100
|
#27
Exceptional
18.4%
Immigrants | Moldova
100.0
/100
|
#28
Exceptional
18.5%
Immigrants | Poland
100.0
/100
|
#29
Exceptional
18.5%
Immigrants | North Macedonia
99.9
/100
|
#30
Exceptional
18.5%
Immigrants | Asia
99.9
/100
|
#31
Exceptional
18.6%
Immigrants | Sri Lanka
99.9
/100
|
#32
Exceptional
18.6%