Immigrants from Southern Europe vs Bangladeshi Family Poverty
COMPARE
Immigrants from Southern Europe
Bangladeshi
Family Poverty
Family Poverty Comparison
Immigrants from Southern Europe
Bangladeshis
8.5%
FAMILY POVERTY
86.0/ 100
METRIC RATING
137th/ 347
METRIC RANK
10.9%
FAMILY POVERTY
0.2/ 100
METRIC RATING
260th/ 347
METRIC RANK
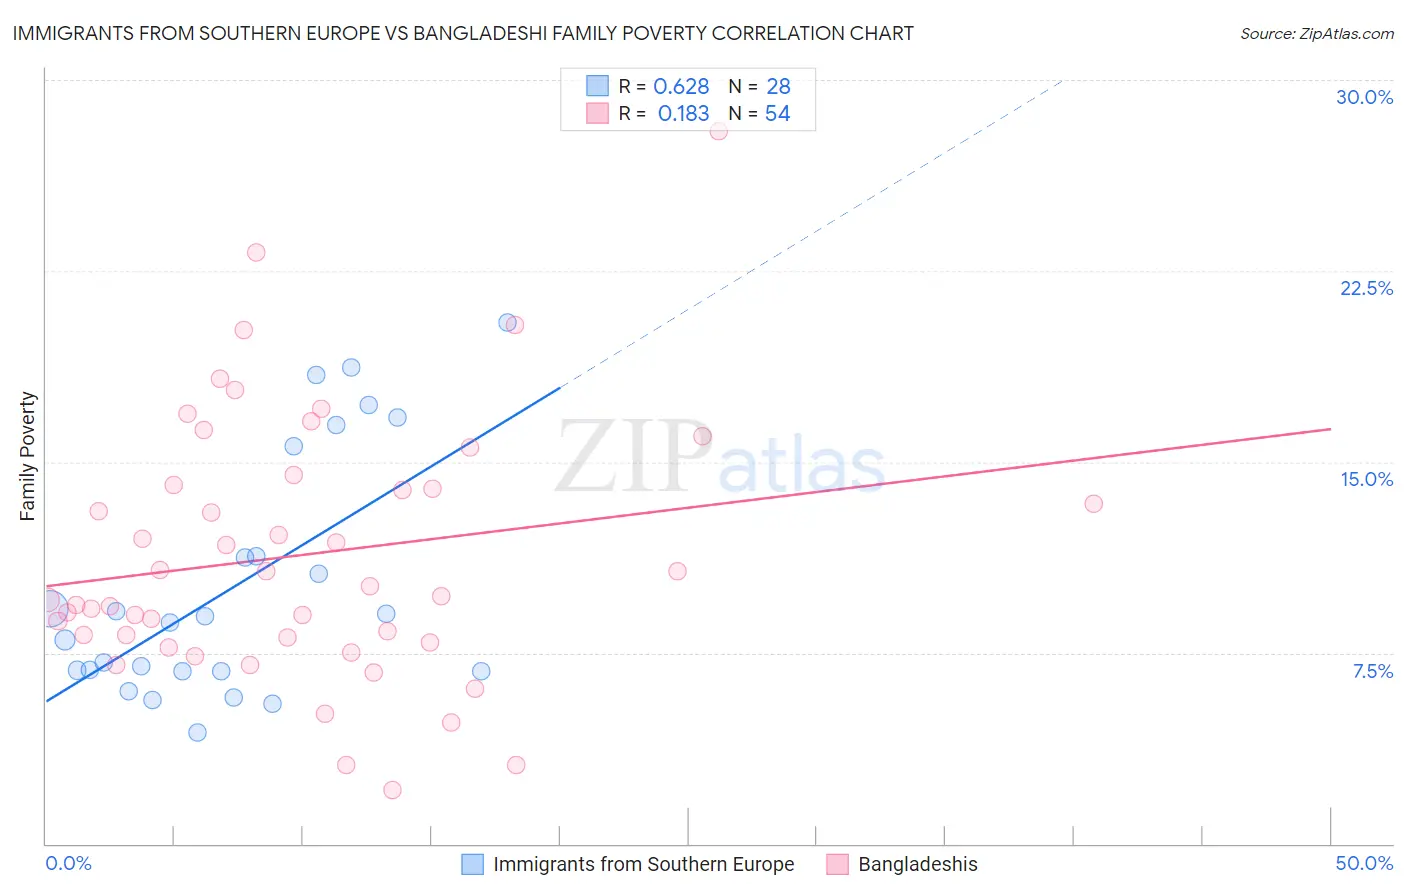
Immigrants from Southern Europe vs Bangladeshi Family Poverty Correlation Chart
The statistical analysis conducted on geographies consisting of 401,468,990 people shows a significant positive correlation between the proportion of Immigrants from Southern Europe and poverty level among families in the United States with a correlation coefficient (R) of 0.628 and weighted average of 8.5%. Similarly, the statistical analysis conducted on geographies consisting of 141,248,982 people shows a poor positive correlation between the proportion of Bangladeshis and poverty level among families in the United States with a correlation coefficient (R) of 0.183 and weighted average of 10.9%, a difference of 28.6%.
Family Poverty Correlation Summary
| Measurement | Immigrants from Southern Europe | Bangladeshi |
| Minimum | 4.4% | 2.1% |
| Maximum | 20.5% | 28.0% |
| Range | 16.1% | 25.9% |
| Mean | 10.2% | 11.3% |
| Median | 8.8% | 9.9% |
| Interquartile 25% (IQ1) | 6.8% | 8.1% |
| Interquartile 75% (IQ3) | 13.5% | 14.1% |
| Interquartile Range (IQR) | 6.7% | 6.0% |
| Standard Deviation (Sample) | 4.8% | 5.1% |
| Standard Deviation (Population) | 4.7% | 5.1% |
Similar Demographics by Family Poverty
Demographics Similar to Immigrants from Southern Europe by Family Poverty
In terms of family poverty, the demographic groups most similar to Immigrants from Southern Europe are Immigrants from Brazil (8.5%, a difference of 0.080%), Immigrants from Malaysia (8.5%, a difference of 0.12%), Chilean (8.5%, a difference of 0.16%), Sri Lankan (8.5%, a difference of 0.17%), and Armenian (8.5%, a difference of 0.40%).
| Demographics | Rating | Rank | Family Poverty |
| Immigrants | Bosnia and Herzegovina | 88.6 /100 | #130 | Excellent 8.4% |
| Puget Sound Salish | 88.6 /100 | #131 | Excellent 8.4% |
| Immigrants | Argentina | 88.2 /100 | #132 | Excellent 8.4% |
| Sri Lankans | 86.6 /100 | #133 | Excellent 8.5% |
| Chileans | 86.6 /100 | #134 | Excellent 8.5% |
| Immigrants | Malaysia | 86.5 /100 | #135 | Excellent 8.5% |
| Immigrants | Brazil | 86.3 /100 | #136 | Excellent 8.5% |
| Immigrants | Southern Europe | 86.0 /100 | #137 | Excellent 8.5% |
| Armenians | 84.6 /100 | #138 | Excellent 8.5% |
| Immigrants | Nepal | 84.2 /100 | #139 | Excellent 8.5% |
| Immigrants | Kazakhstan | 84.1 /100 | #140 | Excellent 8.5% |
| Immigrants | Ukraine | 83.9 /100 | #141 | Excellent 8.5% |
| Yugoslavians | 83.5 /100 | #142 | Excellent 8.5% |
| Immigrants | Germany | 83.3 /100 | #143 | Excellent 8.5% |
| Albanians | 83.3 /100 | #144 | Excellent 8.5% |
Demographics Similar to Bangladeshis by Family Poverty
In terms of family poverty, the demographic groups most similar to Bangladeshis are Shoshone (10.9%, a difference of 0.030%), Spanish American Indian (10.9%, a difference of 0.17%), Mexican American Indian (10.9%, a difference of 0.35%), Subsaharan African (10.9%, a difference of 0.39%), and Immigrants from Ghana (10.8%, a difference of 0.42%).
| Demographics | Rating | Rank | Family Poverty |
| Immigrants | Western Africa | 0.3 /100 | #253 | Tragic 10.7% |
| Ecuadorians | 0.2 /100 | #254 | Tragic 10.8% |
| Immigrants | Liberia | 0.2 /100 | #255 | Tragic 10.8% |
| Chickasaw | 0.2 /100 | #256 | Tragic 10.8% |
| Immigrants | Ghana | 0.2 /100 | #257 | Tragic 10.8% |
| Sub-Saharan Africans | 0.2 /100 | #258 | Tragic 10.9% |
| Mexican American Indians | 0.2 /100 | #259 | Tragic 10.9% |
| Bangladeshis | 0.2 /100 | #260 | Tragic 10.9% |
| Shoshone | 0.2 /100 | #261 | Tragic 10.9% |
| Spanish American Indians | 0.2 /100 | #262 | Tragic 10.9% |
| Cape Verdeans | 0.1 /100 | #263 | Tragic 10.9% |
| Trinidadians and Tobagonians | 0.1 /100 | #264 | Tragic 10.9% |
| Immigrants | Trinidad and Tobago | 0.1 /100 | #265 | Tragic 10.9% |
| Immigrants | El Salvador | 0.1 /100 | #266 | Tragic 11.0% |
| Comanche | 0.1 /100 | #267 | Tragic 11.0% |