Immigrants from Sierra Leone vs English Female Poverty
COMPARE
Immigrants from Sierra Leone
English
Female Poverty
Female Poverty Comparison
Immigrants from Sierra Leone
English
13.5%
FEMALE POVERTY
43.2/ 100
METRIC RATING
184th/ 347
METRIC RANK
12.4%
FEMALE POVERTY
96.1/ 100
METRIC RATING
89th/ 347
METRIC RANK
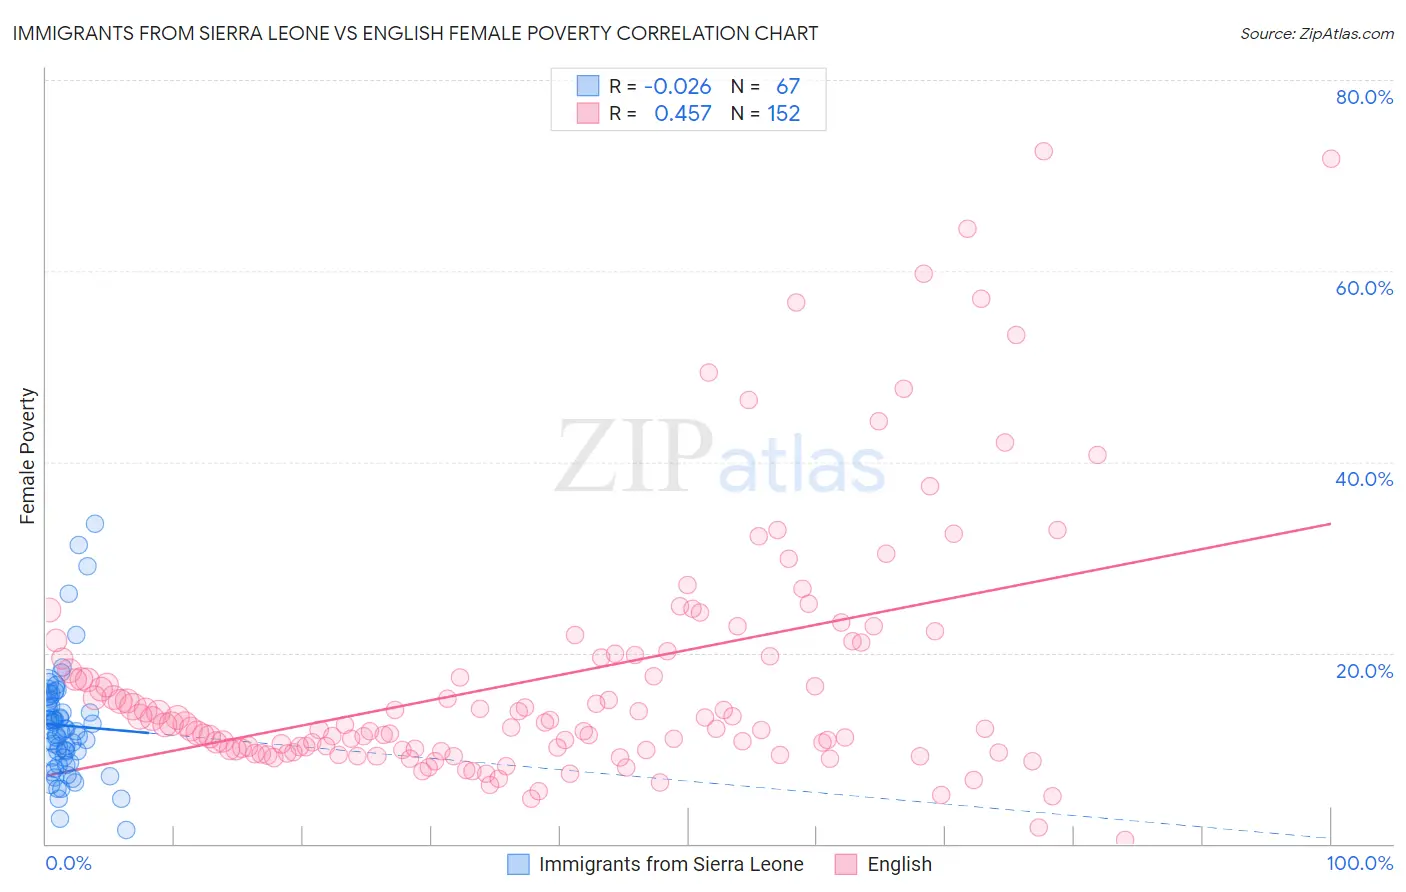
Immigrants from Sierra Leone vs English Female Poverty Correlation Chart
The statistical analysis conducted on geographies consisting of 101,642,339 people shows no correlation between the proportion of Immigrants from Sierra Leone and poverty level among females in the United States with a correlation coefficient (R) of -0.026 and weighted average of 13.5%. Similarly, the statistical analysis conducted on geographies consisting of 578,145,061 people shows a moderate positive correlation between the proportion of English and poverty level among females in the United States with a correlation coefficient (R) of 0.457 and weighted average of 12.4%, a difference of 9.1%.
Female Poverty Correlation Summary
| Measurement | Immigrants from Sierra Leone | English |
| Minimum | 1.5% | 0.38% |
| Maximum | 33.5% | 72.5% |
| Range | 32.0% | 72.2% |
| Mean | 12.4% | 17.3% |
| Median | 11.8% | 12.4% |
| Interquartile 25% (IQ1) | 8.4% | 9.8% |
| Interquartile 75% (IQ3) | 14.9% | 19.7% |
| Interquartile Range (IQR) | 6.4% | 9.9% |
| Standard Deviation (Sample) | 6.0% | 13.4% |
| Standard Deviation (Population) | 5.9% | 13.3% |
Similar Demographics by Female Poverty
Demographics Similar to Immigrants from Sierra Leone by Female Poverty
In terms of female poverty, the demographic groups most similar to Immigrants from Sierra Leone are Kenyan (13.5%, a difference of 0.060%), Immigrants from Cameroon (13.5%, a difference of 0.11%), Venezuelan (13.5%, a difference of 0.13%), Immigrants from Colombia (13.5%, a difference of 0.13%), and South American (13.5%, a difference of 0.16%).
| Demographics | Rating | Rank | Female Poverty |
| Immigrants | Morocco | 49.4 /100 | #177 | Average 13.4% |
| Israelis | 49.1 /100 | #178 | Average 13.5% |
| Immigrants | Syria | 48.8 /100 | #179 | Average 13.5% |
| South Americans | 44.8 /100 | #180 | Average 13.5% |
| Venezuelans | 44.5 /100 | #181 | Average 13.5% |
| Immigrants | Colombia | 44.5 /100 | #182 | Average 13.5% |
| Kenyans | 43.8 /100 | #183 | Average 13.5% |
| Immigrants | Sierra Leone | 43.2 /100 | #184 | Average 13.5% |
| Immigrants | Cameroon | 42.0 /100 | #185 | Average 13.5% |
| Immigrants | Portugal | 41.5 /100 | #186 | Average 13.6% |
| Immigrants | Venezuela | 41.0 /100 | #187 | Average 13.6% |
| Hawaiians | 39.9 /100 | #188 | Fair 13.6% |
| Uruguayans | 39.8 /100 | #189 | Fair 13.6% |
| Sierra Leoneans | 33.1 /100 | #190 | Fair 13.7% |
| Immigrants | Kuwait | 32.7 /100 | #191 | Fair 13.7% |
Demographics Similar to English by Female Poverty
In terms of female poverty, the demographic groups most similar to English are Finnish (12.4%, a difference of 0.20%), Immigrants from Denmark (12.4%, a difference of 0.22%), Belgian (12.4%, a difference of 0.23%), Okinawan (12.4%, a difference of 0.24%), and Czechoslovakian (12.4%, a difference of 0.24%).
| Demographics | Rating | Rank | Female Poverty |
| Jordanians | 97.1 /100 | #82 | Exceptional 12.3% |
| Immigrants | England | 96.9 /100 | #83 | Exceptional 12.3% |
| Northern Europeans | 96.6 /100 | #84 | Exceptional 12.4% |
| Irish | 96.5 /100 | #85 | Exceptional 12.4% |
| Dutch | 96.5 /100 | #86 | Exceptional 12.4% |
| Okinawans | 96.4 /100 | #87 | Exceptional 12.4% |
| Finns | 96.4 /100 | #88 | Exceptional 12.4% |
| English | 96.1 /100 | #89 | Exceptional 12.4% |
| Immigrants | Denmark | 95.8 /100 | #90 | Exceptional 12.4% |
| Belgians | 95.8 /100 | #91 | Exceptional 12.4% |
| Czechoslovakians | 95.7 /100 | #92 | Exceptional 12.4% |
| Immigrants | Egypt | 95.5 /100 | #93 | Exceptional 12.5% |
| Immigrants | Indonesia | 95.4 /100 | #94 | Exceptional 12.5% |
| Immigrants | South Africa | 95.4 /100 | #95 | Exceptional 12.5% |
| British | 95.2 /100 | #96 | Exceptional 12.5% |