Immigrants from Serbia vs Cypriot Child Poverty Among Boys Under 16
COMPARE
Immigrants from Serbia
Cypriot
Child Poverty Among Boys Under 16
Child Poverty Among Boys Under 16 Comparison
Immigrants from Serbia
Cypriots
14.3%
CHILD POVERTY AMONG BOYS UNDER 16
99.0/ 100
METRIC RATING
54th/ 347
METRIC RANK
13.6%
CHILD POVERTY AMONG BOYS UNDER 16
99.8/ 100
METRIC RATING
29th/ 347
METRIC RANK
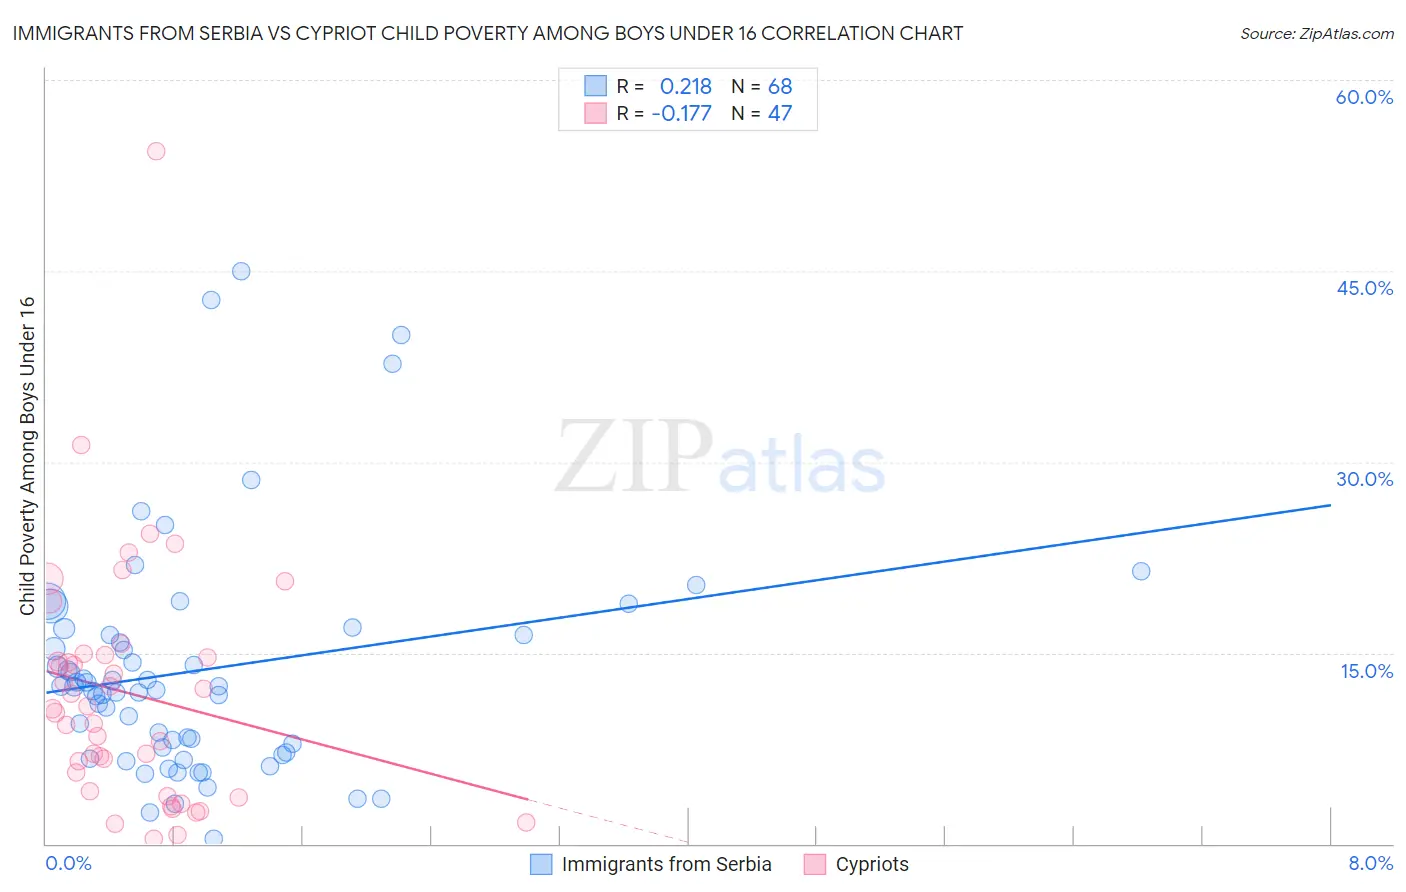
Immigrants from Serbia vs Cypriot Child Poverty Among Boys Under 16 Correlation Chart
The statistical analysis conducted on geographies consisting of 130,954,888 people shows a weak positive correlation between the proportion of Immigrants from Serbia and poverty level among boys under the age of 16 in the United States with a correlation coefficient (R) of 0.218 and weighted average of 14.3%. Similarly, the statistical analysis conducted on geographies consisting of 61,411,047 people shows a poor negative correlation between the proportion of Cypriots and poverty level among boys under the age of 16 in the United States with a correlation coefficient (R) of -0.177 and weighted average of 13.6%, a difference of 5.8%.
Child Poverty Among Boys Under 16 Correlation Summary
| Measurement | Immigrants from Serbia | Cypriot |
| Minimum | 0.43% | 0.43% |
| Maximum | 45.0% | 54.4% |
| Range | 44.6% | 53.9% |
| Mean | 13.6% | 11.8% |
| Median | 12.2% | 10.6% |
| Interquartile 25% (IQ1) | 7.3% | 4.1% |
| Interquartile 75% (IQ3) | 16.4% | 14.9% |
| Interquartile Range (IQR) | 9.0% | 10.8% |
| Standard Deviation (Sample) | 9.1% | 9.6% |
| Standard Deviation (Population) | 9.0% | 9.5% |
Similar Demographics by Child Poverty Among Boys Under 16
Demographics Similar to Immigrants from Serbia by Child Poverty Among Boys Under 16
In terms of child poverty among boys under 16, the demographic groups most similar to Immigrants from Serbia are Immigrants from Pakistan (14.3%, a difference of 0.050%), Zimbabwean (14.3%, a difference of 0.050%), Immigrants from Philippines (14.3%, a difference of 0.080%), Laotian (14.3%, a difference of 0.12%), and Polish (14.4%, a difference of 0.15%).
| Demographics | Rating | Rank | Child Poverty Among Boys Under 16 |
| Immigrants | Moldova | 99.4 /100 | #47 | Exceptional 14.1% |
| Immigrants | Indonesia | 99.4 /100 | #48 | Exceptional 14.1% |
| Czechs | 99.3 /100 | #49 | Exceptional 14.1% |
| Italians | 99.2 /100 | #50 | Exceptional 14.2% |
| Immigrants | Greece | 99.2 /100 | #51 | Exceptional 14.2% |
| Laotians | 99.0 /100 | #52 | Exceptional 14.3% |
| Immigrants | Philippines | 99.0 /100 | #53 | Exceptional 14.3% |
| Immigrants | Serbia | 99.0 /100 | #54 | Exceptional 14.3% |
| Immigrants | Pakistan | 99.0 /100 | #55 | Exceptional 14.3% |
| Zimbabweans | 99.0 /100 | #56 | Exceptional 14.3% |
| Poles | 98.9 /100 | #57 | Exceptional 14.4% |
| Immigrants | Sweden | 98.9 /100 | #58 | Exceptional 14.4% |
| Immigrants | Czechoslovakia | 98.9 /100 | #59 | Exceptional 14.4% |
| Immigrants | Belgium | 98.9 /100 | #60 | Exceptional 14.4% |
| Scandinavians | 98.8 /100 | #61 | Exceptional 14.4% |
Demographics Similar to Cypriots by Child Poverty Among Boys Under 16
In terms of child poverty among boys under 16, the demographic groups most similar to Cypriots are Swedish (13.6%, a difference of 0.090%), Turkish (13.6%, a difference of 0.18%), Eastern European (13.5%, a difference of 0.19%), Asian (13.5%, a difference of 0.26%), and Immigrants from China (13.6%, a difference of 0.27%).
| Demographics | Rating | Rank | Child Poverty Among Boys Under 16 |
| Tongans | 99.9 /100 | #22 | Exceptional 13.4% |
| Latvians | 99.9 /100 | #23 | Exceptional 13.4% |
| Immigrants | Lithuania | 99.8 /100 | #24 | Exceptional 13.5% |
| Okinawans | 99.8 /100 | #25 | Exceptional 13.5% |
| Immigrants | Bolivia | 99.8 /100 | #26 | Exceptional 13.5% |
| Asians | 99.8 /100 | #27 | Exceptional 13.5% |
| Eastern Europeans | 99.8 /100 | #28 | Exceptional 13.5% |
| Cypriots | 99.8 /100 | #29 | Exceptional 13.6% |
| Swedes | 99.8 /100 | #30 | Exceptional 13.6% |
| Turks | 99.8 /100 | #31 | Exceptional 13.6% |
| Immigrants | China | 99.8 /100 | #32 | Exceptional 13.6% |
| Danes | 99.8 /100 | #33 | Exceptional 13.6% |
| Assyrians/Chaldeans/Syriacs | 99.8 /100 | #34 | Exceptional 13.6% |
| Russians | 99.7 /100 | #35 | Exceptional 13.8% |
| Luxembourgers | 99.7 /100 | #36 | Exceptional 13.8% |