Immigrants from Serbia vs Blackfeet Child Poverty Among Boys Under 16
COMPARE
Immigrants from Serbia
Blackfeet
Child Poverty Among Boys Under 16
Child Poverty Among Boys Under 16 Comparison
Immigrants from Serbia
Blackfeet
14.3%
CHILD POVERTY AMONG BOYS UNDER 16
99.0/ 100
METRIC RATING
54th/ 347
METRIC RANK
20.4%
CHILD POVERTY AMONG BOYS UNDER 16
0.0/ 100
METRIC RATING
289th/ 347
METRIC RANK
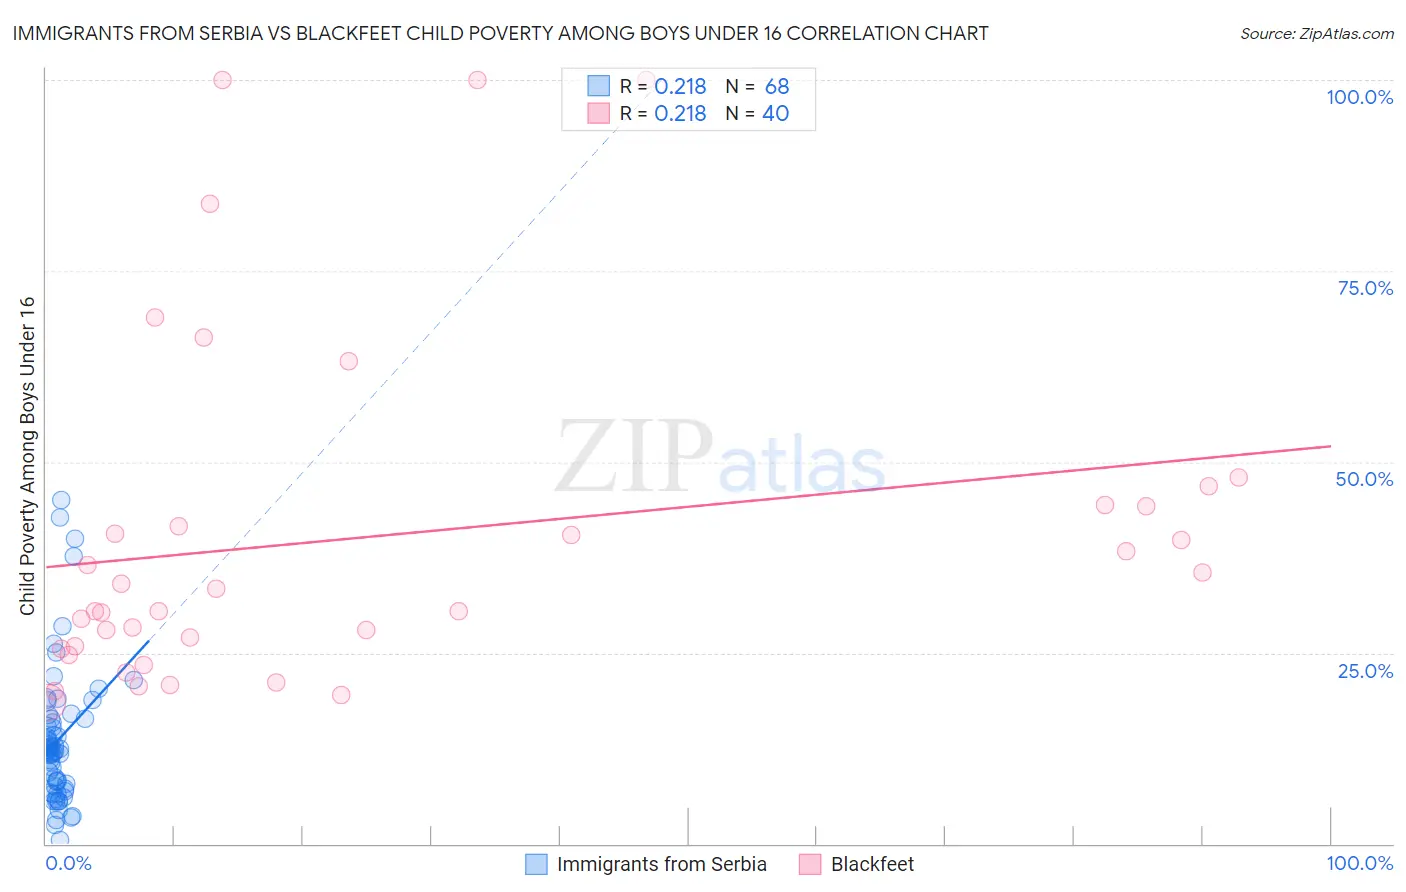
Immigrants from Serbia vs Blackfeet Child Poverty Among Boys Under 16 Correlation Chart
The statistical analysis conducted on geographies consisting of 130,954,888 people shows a weak positive correlation between the proportion of Immigrants from Serbia and poverty level among boys under the age of 16 in the United States with a correlation coefficient (R) of 0.218 and weighted average of 14.3%. Similarly, the statistical analysis conducted on geographies consisting of 307,014,891 people shows a weak positive correlation between the proportion of Blackfeet and poverty level among boys under the age of 16 in the United States with a correlation coefficient (R) of 0.218 and weighted average of 20.4%, a difference of 42.0%.
Child Poverty Among Boys Under 16 Correlation Summary
| Measurement | Immigrants from Serbia | Blackfeet |
| Minimum | 0.43% | 18.5% |
| Maximum | 45.0% | 100.0% |
| Range | 44.6% | 81.5% |
| Mean | 13.6% | 40.3% |
| Median | 12.2% | 31.9% |
| Interquartile 25% (IQ1) | 7.3% | 25.7% |
| Interquartile 75% (IQ3) | 16.4% | 44.2% |
| Interquartile Range (IQR) | 9.0% | 18.6% |
| Standard Deviation (Sample) | 9.1% | 22.5% |
| Standard Deviation (Population) | 9.0% | 22.2% |
Similar Demographics by Child Poverty Among Boys Under 16
Demographics Similar to Immigrants from Serbia by Child Poverty Among Boys Under 16
In terms of child poverty among boys under 16, the demographic groups most similar to Immigrants from Serbia are Immigrants from Pakistan (14.3%, a difference of 0.050%), Zimbabwean (14.3%, a difference of 0.050%), Immigrants from Philippines (14.3%, a difference of 0.080%), Laotian (14.3%, a difference of 0.12%), and Polish (14.4%, a difference of 0.15%).
| Demographics | Rating | Rank | Child Poverty Among Boys Under 16 |
| Immigrants | Moldova | 99.4 /100 | #47 | Exceptional 14.1% |
| Immigrants | Indonesia | 99.4 /100 | #48 | Exceptional 14.1% |
| Czechs | 99.3 /100 | #49 | Exceptional 14.1% |
| Italians | 99.2 /100 | #50 | Exceptional 14.2% |
| Immigrants | Greece | 99.2 /100 | #51 | Exceptional 14.2% |
| Laotians | 99.0 /100 | #52 | Exceptional 14.3% |
| Immigrants | Philippines | 99.0 /100 | #53 | Exceptional 14.3% |
| Immigrants | Serbia | 99.0 /100 | #54 | Exceptional 14.3% |
| Immigrants | Pakistan | 99.0 /100 | #55 | Exceptional 14.3% |
| Zimbabweans | 99.0 /100 | #56 | Exceptional 14.3% |
| Poles | 98.9 /100 | #57 | Exceptional 14.4% |
| Immigrants | Sweden | 98.9 /100 | #58 | Exceptional 14.4% |
| Immigrants | Czechoslovakia | 98.9 /100 | #59 | Exceptional 14.4% |
| Immigrants | Belgium | 98.9 /100 | #60 | Exceptional 14.4% |
| Scandinavians | 98.8 /100 | #61 | Exceptional 14.4% |
Demographics Similar to Blackfeet by Child Poverty Among Boys Under 16
In terms of child poverty among boys under 16, the demographic groups most similar to Blackfeet are Immigrants from St. Vincent and the Grenadines (20.3%, a difference of 0.24%), Immigrants from Belize (20.3%, a difference of 0.52%), West Indian (20.3%, a difference of 0.57%), Senegalese (20.6%, a difference of 0.91%), and Arapaho (20.2%, a difference of 0.92%).
| Demographics | Rating | Rank | Child Poverty Among Boys Under 16 |
| Comanche | 0.0 /100 | #282 | Tragic 20.1% |
| Immigrants | Jamaica | 0.0 /100 | #283 | Tragic 20.1% |
| Barbadians | 0.0 /100 | #284 | Tragic 20.2% |
| Arapaho | 0.0 /100 | #285 | Tragic 20.2% |
| West Indians | 0.0 /100 | #286 | Tragic 20.3% |
| Immigrants | Belize | 0.0 /100 | #287 | Tragic 20.3% |
| Immigrants | St. Vincent and the Grenadines | 0.0 /100 | #288 | Tragic 20.3% |
| Blackfeet | 0.0 /100 | #289 | Tragic 20.4% |
| Senegalese | 0.0 /100 | #290 | Tragic 20.6% |
| Immigrants | Latin America | 0.0 /100 | #291 | Tragic 20.6% |
| Yaqui | 0.0 /100 | #292 | Tragic 20.7% |
| Immigrants | Senegal | 0.0 /100 | #293 | Tragic 20.7% |
| Immigrants | Bahamas | 0.0 /100 | #294 | Tragic 20.7% |
| Mexicans | 0.0 /100 | #295 | Tragic 20.7% |
| Indonesians | 0.0 /100 | #296 | Tragic 20.8% |