Immigrants from Senegal vs Tohono O'odham Female Poverty
COMPARE
Immigrants from Senegal
Tohono O'odham
Female Poverty
Female Poverty Comparison
Immigrants from Senegal
Tohono O'odham
16.5%
FEMALE POVERTY
0.0/ 100
METRIC RATING
296th/ 347
METRIC RANK
25.9%
FEMALE POVERTY
0.0/ 100
METRIC RATING
347th/ 347
METRIC RANK
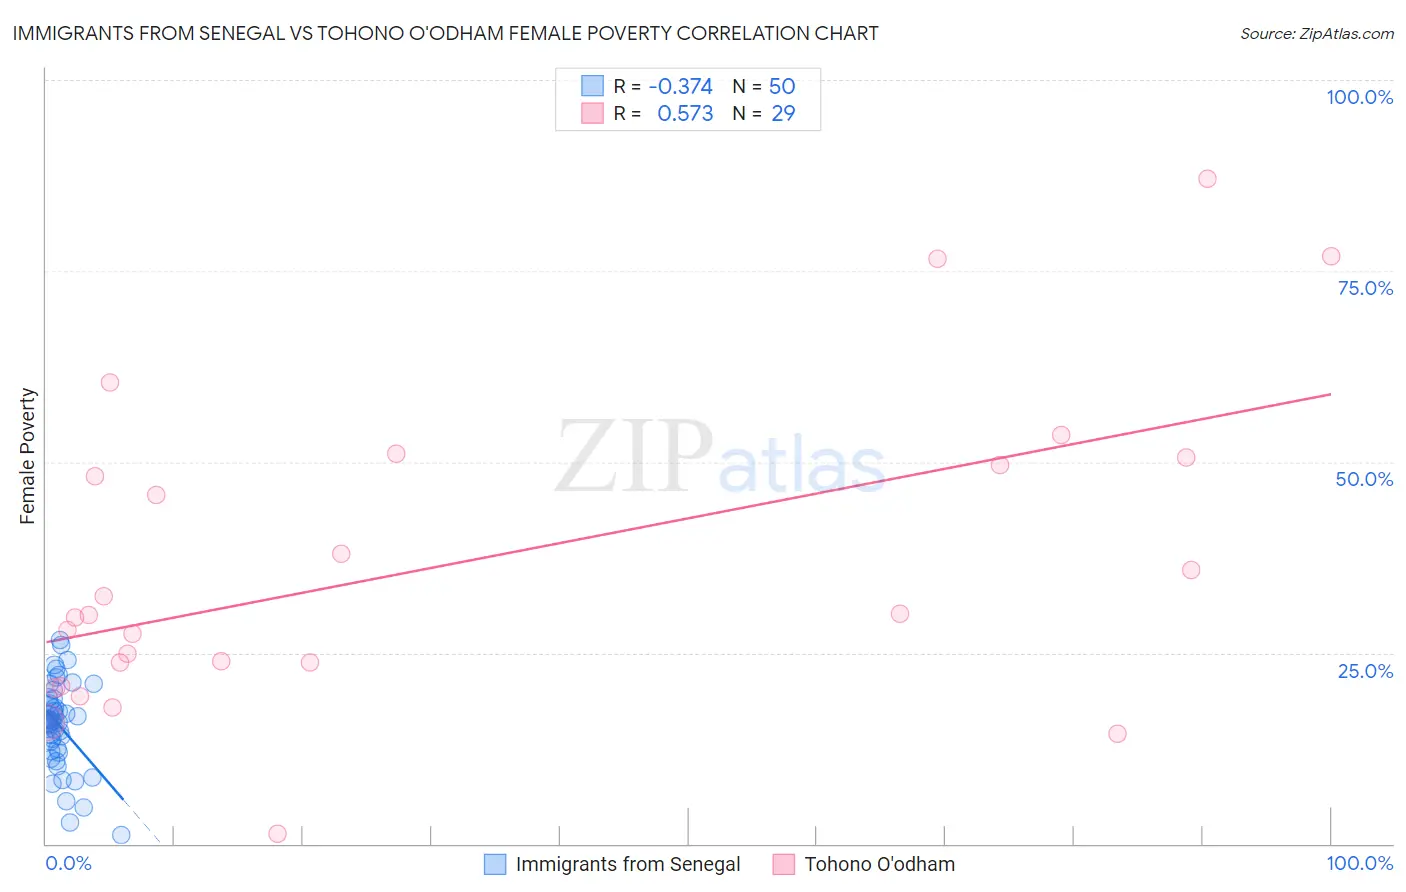
Immigrants from Senegal vs Tohono O'odham Female Poverty Correlation Chart
The statistical analysis conducted on geographies consisting of 90,102,855 people shows a mild negative correlation between the proportion of Immigrants from Senegal and poverty level among females in the United States with a correlation coefficient (R) of -0.374 and weighted average of 16.5%. Similarly, the statistical analysis conducted on geographies consisting of 58,715,136 people shows a substantial positive correlation between the proportion of Tohono O'odham and poverty level among females in the United States with a correlation coefficient (R) of 0.573 and weighted average of 25.9%, a difference of 57.6%.
Female Poverty Correlation Summary
| Measurement | Immigrants from Senegal | Tohono O'odham |
| Minimum | 1.1% | 1.4% |
| Maximum | 26.7% | 87.1% |
| Range | 25.6% | 85.7% |
| Mean | 15.4% | 36.5% |
| Median | 16.0% | 30.0% |
| Interquartile 25% (IQ1) | 12.2% | 22.2% |
| Interquartile 75% (IQ3) | 19.0% | 50.0% |
| Interquartile Range (IQR) | 6.8% | 27.9% |
| Standard Deviation (Sample) | 5.7% | 20.4% |
| Standard Deviation (Population) | 5.6% | 20.1% |
Similar Demographics by Female Poverty
Demographics Similar to Immigrants from Senegal by Female Poverty
In terms of female poverty, the demographic groups most similar to Immigrants from Senegal are Senegalese (16.5%, a difference of 0.020%), Immigrants from Cabo Verde (16.4%, a difference of 0.10%), Immigrants from Latin America (16.4%, a difference of 0.13%), Immigrants from Zaire (16.4%, a difference of 0.19%), and Yaqui (16.4%, a difference of 0.20%).
| Demographics | Rating | Rank | Female Poverty |
| Blackfeet | 0.0 /100 | #289 | Tragic 16.4% |
| Immigrants | Bangladesh | 0.0 /100 | #290 | Tragic 16.4% |
| Yaqui | 0.0 /100 | #291 | Tragic 16.4% |
| Immigrants | Zaire | 0.0 /100 | #292 | Tragic 16.4% |
| Immigrants | Latin America | 0.0 /100 | #293 | Tragic 16.4% |
| Immigrants | Cabo Verde | 0.0 /100 | #294 | Tragic 16.4% |
| Senegalese | 0.0 /100 | #295 | Tragic 16.5% |
| Immigrants | Senegal | 0.0 /100 | #296 | Tragic 16.5% |
| Mexicans | 0.0 /100 | #297 | Tragic 16.5% |
| Somalis | 0.0 /100 | #298 | Tragic 16.6% |
| Hispanics or Latinos | 0.0 /100 | #299 | Tragic 16.6% |
| Bahamians | 0.0 /100 | #300 | Tragic 16.6% |
| Guatemalans | 0.0 /100 | #301 | Tragic 16.7% |
| Chippewa | 0.0 /100 | #302 | Tragic 16.7% |
| Choctaw | 0.0 /100 | #303 | Tragic 16.8% |
Demographics Similar to Tohono O'odham by Female Poverty
In terms of female poverty, the demographic groups most similar to Tohono O'odham are Puerto Rican (25.2%, a difference of 3.0%), Navajo (23.9%, a difference of 8.6%), Pima (23.6%, a difference of 10.0%), Lumbee (23.5%, a difference of 10.3%), and Immigrants from Yemen (22.8%, a difference of 13.6%).
| Demographics | Rating | Rank | Female Poverty |
| Immigrants | Dominican Republic | 0.0 /100 | #333 | Tragic 19.3% |
| Houma | 0.0 /100 | #334 | Tragic 20.0% |
| Cheyenne | 0.0 /100 | #335 | Tragic 20.2% |
| Pueblo | 0.0 /100 | #336 | Tragic 20.7% |
| Yuman | 0.0 /100 | #337 | Tragic 20.8% |
| Sioux | 0.0 /100 | #338 | Tragic 20.9% |
| Hopi | 0.0 /100 | #339 | Tragic 21.0% |
| Yup'ik | 0.0 /100 | #340 | Tragic 21.5% |
| Crow | 0.0 /100 | #341 | Tragic 22.1% |
| Immigrants | Yemen | 0.0 /100 | #342 | Tragic 22.8% |
| Lumbee | 0.0 /100 | #343 | Tragic 23.5% |
| Pima | 0.0 /100 | #344 | Tragic 23.6% |
| Navajo | 0.0 /100 | #345 | Tragic 23.9% |
| Puerto Ricans | 0.0 /100 | #346 | Tragic 25.2% |
| Tohono O'odham | 0.0 /100 | #347 | Tragic 25.9% |