Immigrants from Romania vs Shoshone Female Poverty

COMPARE

Immigrants from Romania
Race
Ancestry
AfghanAfricanAlaska NativeAlaskan AthabascanAlbanianAleutAlsatianAmericanApacheArabArapahoArgentineanArmenianAssyrian/Chaldean/SyriacAustralianAustrianBahamianBangladeshiBarbadianBasqueBelgianBelizeanBermudanBhutaneseBlackfeetBolivianBrazilianBritishBritish West IndianBulgarianBurmeseCajunCambodianCanadianCape VerdeanCarpatho RusynCelticCentral AmericanCentral American IndianCherokeeCheyenneChickasawChileanChineseChippewaChoctawColombianColvilleComancheCosta RicanCreeCreekCroatianCrowCubanCypriotCzechCzechoslovakianDanishDelawareDominicanDutchDutch West IndianEastern EuropeanEcuadorianEgyptianEnglishEstonianEthiopianEuropeanFijianFilipinoFinnishFrenchFrench American IndianFrench CanadianGermanGerman RussianGhanaianGreekGuamanian/ChamorroGuatemalanGuyaneseHaitianHmongHonduranHopiHoumaHungarianIcelanderIndian (Asian)IndonesianInupiatIranianIraqiIrishIroquoisIsraeliItalianJamaicanJapaneseJordanianKenyanKiowaKoreanLaotianLatvianLebaneseLiberianLithuanianLumbeeLuxembourgerMacedonianMalaysianMalteseMarshalleseMenomineeMexicanMexican American IndianMongolianMoroccanNative HawaiianNavajoNepaleseNew ZealanderNicaraguanNigerianNorthern EuropeanNorwegianOkinawanOsageOttawaPaiutePakistaniPalestinianPanamanianParaguayanPennsylvania GermanPeruvianPimaPolishPortuguesePotawatomiPuebloPuerto RicanPuget Sound SalishRomanianRussianSalvadoranSamoanScandinavianScotch-IrishScottishSeminoleSenegaleseSerbianSierra LeoneanSiouxSlavicSlovakSloveneSomaliSouth AfricanSouth AmericanSouth American IndianSoviet UnionSpaniardSpanishSpanish AmericanSpanish American IndianSri LankanSubsaharan AfricanSudaneseSwedishSwissSyrianTaiwaneseThaiTlingit-HaidaTohono O'OdhamTonganTrinidadian and TobagonianTsimshianTurkishU.S. Virgin IslanderUgandanUkrainianUruguayanUteVenezuelanVietnameseWelshWest IndianYakamaYaquiYugoslavianYumanYup'ikZimbabwean
Immigration
NonimmigrantsImmigrantsAfghanistanAfricaAlbaniaArgentinaArmeniaAsiaAustraliaAustriaBahamasBangladeshBarbadosBelarusBelgiumBelizeBoliviaBosnia and HerzegovinaBrazilBulgariaBurma/MyanmarCabo VerdeCambodiaCameroonCanadaCaribbeanCentral AmericaChileChinaColombiaCongoCosta RicaCroatiaCubaCzechoslovakiaDenmarkDominicaDominican RepublicEastern AfricaEastern AsiaEastern EuropeEcuadorEgyptEl SalvadorEnglandEritreaEthiopiaEuropeFijiFranceGermanyGhanaGreeceGrenadaGuatemalaGuyanaHaitiHondurasHong KongHungaryIndiaIndonesiaIranIraqIrelandIsraelItalyJamaicaJapanJordanKazakhstanKenyaKoreaKuwaitLaosLatin AmericaLatviaLebanonLiberiaLithuaniaMalaysiaMexicoMicronesiaMiddle AfricaMoldovaMoroccoNepalNetherlandsNicaraguaNigeriaNorth AmericaNorth MacedoniaNorthern AfricaNorthern EuropeNorwayOceaniaPakistanPanamaPeruPhilippinesPolandPortugalRomaniaRussiaSaudi ArabiaScotlandSenegalSerbiaSierra LeoneSingaporeSomaliaSouth AfricaSouth AmericaSouth Central AsiaSouth Eastern AsiaSouthern EuropeSpainSri LankaSt. Vincent and the GrenadinesSudanSwedenSwitzerlandSyriaTaiwanThailandTrinidad and TobagoTurkeyUgandaUkraineUruguayUzbekistanVenezuelaVietnamWest IndiesWestern AfricaWestern AsiaWestern EuropeYemenZaireZimbabweAzores
Shoshone
Race
Ancestry
AfghanAfricanAlaska NativeAlaskan AthabascanAlbanianAleutAlsatianAmericanApacheArabArapahoArgentineanArmenianAssyrian/Chaldean/SyriacAustralianAustrianBahamianBangladeshiBarbadianBasqueBelgianBelizeanBermudanBhutaneseBlackfeetBolivianBrazilianBritishBritish West IndianBulgarianBurmeseCajunCambodianCanadianCape VerdeanCarpatho RusynCelticCentral AmericanCentral American IndianCherokeeCheyenneChickasawChileanChineseChippewaChoctawColombianColvilleComancheCosta RicanCreeCreekCroatianCrowCubanCypriotCzechCzechoslovakianDanishDelawareDominicanDutchDutch West IndianEastern EuropeanEcuadorianEgyptianEnglishEstonianEthiopianEuropeanFijianFilipinoFinnishFrenchFrench American IndianFrench CanadianGermanGerman RussianGhanaianGreekGuamanian/ChamorroGuatemalanGuyaneseHaitianHmongHonduranHopiHoumaHungarianIcelanderIndian (Asian)IndonesianInupiatIranianIraqiIrishIroquoisIsraeliItalianJamaicanJapaneseJordanianKenyanKiowaKoreanLaotianLatvianLebaneseLiberianLithuanianLumbeeLuxembourgerMacedonianMalaysianMalteseMarshalleseMenomineeMexicanMexican American IndianMongolianMoroccanNative HawaiianNavajoNepaleseNew ZealanderNicaraguanNigerianNorthern EuropeanNorwegianOkinawanOsageOttawaPaiutePakistaniPalestinianPanamanianParaguayanPennsylvania GermanPeruvianPimaPolishPortuguesePotawatomiPuebloPuerto RicanPuget Sound SalishRomanianRussianSalvadoranSamoanScandinavianScotch-IrishScottishSeminoleSenegaleseSerbianShoshoneSierra LeoneanSiouxSlavicSlovakSloveneSomaliSouth AfricanSouth AmericanSouth American IndianSoviet UnionSpaniardSpanishSpanish AmericanSpanish American IndianSri LankanSubsaharan AfricanSudaneseSwedishSwissSyrianTaiwaneseThaiTlingit-HaidaTohono O'OdhamTonganTrinidadian and TobagonianTsimshianTurkishU.S. Virgin IslanderUgandanUkrainianUruguayanUteVenezuelanVietnameseWelshWest IndianYakamaYaquiYugoslavianYumanYup'ikZimbabwean
Immigration
NonimmigrantsImmigrantsAfghanistanAfricaAlbaniaArgentinaArmeniaAsiaAustraliaAustriaBahamasBangladeshBarbadosBelarusBelgiumBelizeBoliviaBosnia and HerzegovinaBrazilBulgariaBurma/MyanmarCabo VerdeCambodiaCameroonCanadaCaribbeanCentral AmericaChileChinaColombiaCongoCosta RicaCroatiaCubaCzechoslovakiaDenmarkDominicaDominican RepublicEastern AfricaEastern AsiaEastern EuropeEcuadorEgyptEl SalvadorEnglandEritreaEthiopiaEuropeFijiFranceGermanyGhanaGreeceGrenadaGuatemalaGuyanaHaitiHondurasHong KongHungaryIndiaIndonesiaIranIraqIrelandIsraelItalyJamaicaJapanJordanKazakhstanKenyaKoreaKuwaitLaosLatin AmericaLatviaLebanonLiberiaLithuaniaMalaysiaMexicoMicronesiaMiddle AfricaMoldovaMoroccoNepalNetherlandsNicaraguaNigeriaNorth AmericaNorth MacedoniaNorthern AfricaNorthern EuropeNorwayOceaniaPakistanPanamaPeruPhilippinesPolandPortugalRussiaSaudi ArabiaScotlandSenegalSerbiaSierra LeoneSingaporeSomaliaSouth AfricaSouth AmericaSouth Central AsiaSouth Eastern AsiaSouthern EuropeSpainSri LankaSt. Vincent and the GrenadinesSudanSwedenSwitzerlandSyriaTaiwanThailandTrinidad and TobagoTurkeyUgandaUkraineUruguayUzbekistanVenezuelaVietnamWest IndiesWestern AfricaWestern AsiaWestern EuropeYemenZaireZimbabweAzores
Female Poverty
Income
Poverty
Unemployment
Labor Participation
Family Structure
Vehicle Availability
Education Level
Disability

Female Poverty Comparison

Immigrants from Romania

Shoshone

Exceptional
Tragic
12.0%
FEMALE POVERTY
99.0/ 100
METRIC RATING
49th/ 347
METRIC RANK
15.6%
FEMALE POVERTY
0.1/ 100
METRIC RATING
258th/ 347
METRIC RANK

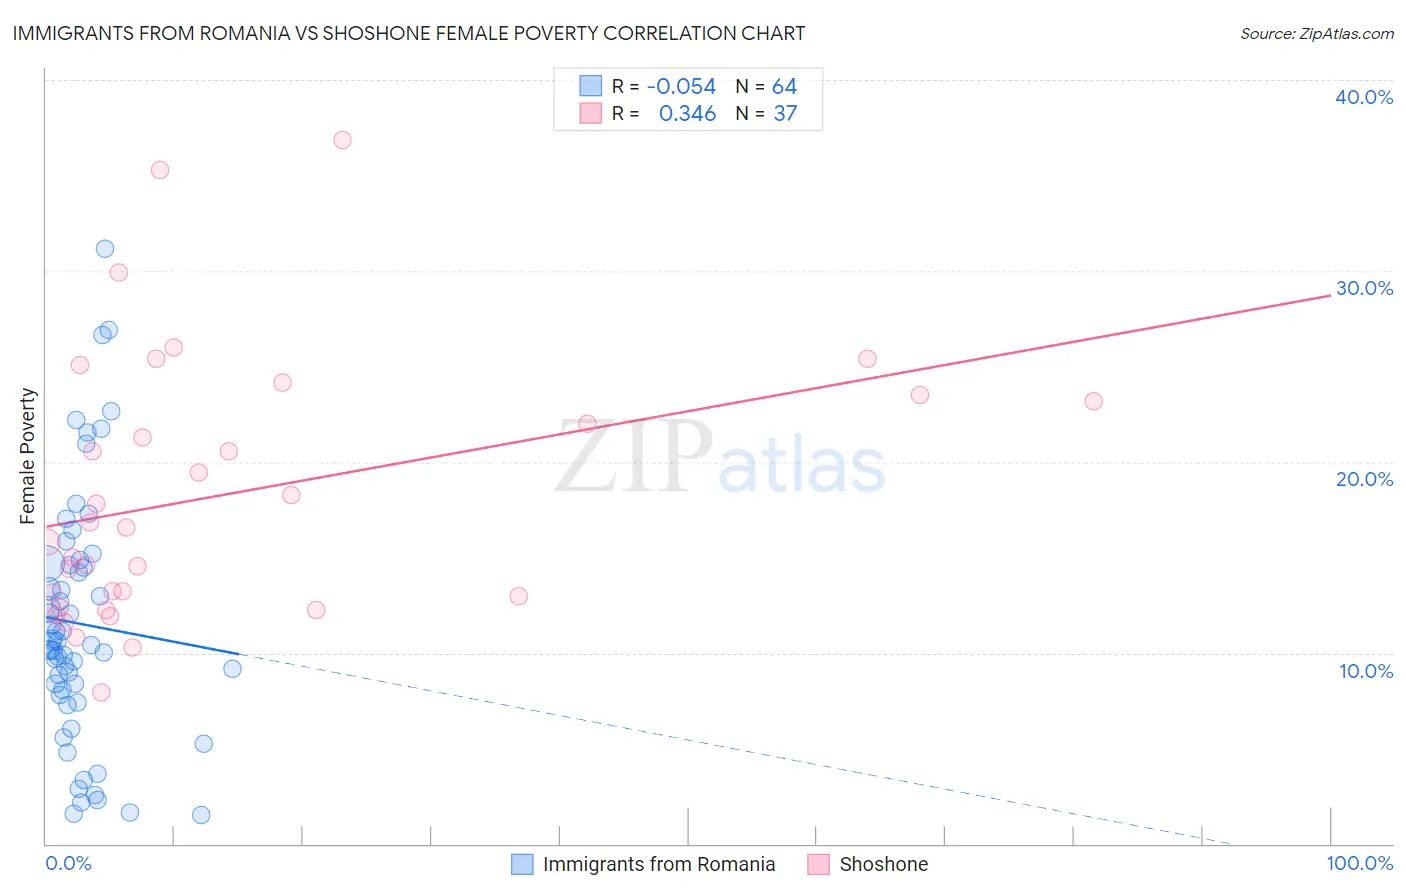
Immigrants from Romania vs Shoshone Female Poverty Correlation Chart

The statistical analysis conducted on geographies consisting of 256,918,121 people shows a slight negative correlation between the proportion of Immigrants from Romania and poverty level among females in the United States with a correlation coefficient (R) of -0.054 and weighted average of 12.0%. Similarly, the statistical analysis conducted on geographies consisting of 66,611,766 people shows a mild positive correlation between the proportion of Shoshone and poverty level among females in the United States with a correlation coefficient (R) of 0.346 and weighted average of 15.6%, a difference of 30.0%.
Immigrants from Romania vs Shoshone Female Poverty

Female Poverty Correlation Summary

MeasurementImmigrants from RomaniaShoshone
Minimum1.5%8.0%
Maximum31.2%36.8%
Range29.7%28.9%
Mean11.5%18.3%
Median10.5%16.6%
Interquartile 25% (IQ1)7.9%12.7%
Interquartile 75% (IQ3)14.6%23.3%
Interquartile Range (IQR)6.7%10.7%
Standard Deviation (Sample)6.5%6.9%
Standard Deviation (Population)6.4%6.8%

Similar Demographics by Female Poverty

Demographics Similar to Immigrants from Romania by Female Poverty

In terms of female poverty, the demographic groups most similar to Immigrants from Romania are Slovene (12.0%, a difference of 0.010%), Immigrants from Japan (11.9%, a difference of 0.19%), Immigrants from Bulgaria (12.0%, a difference of 0.23%), Asian (11.9%, a difference of 0.42%), and Immigrants from Croatia (12.0%, a difference of 0.54%).
DemographicsRating | RankFemale Poverty
Immigrants | Moldova
99.2
/100
|
#42
Exceptional
11.9%
Koreans
99.2
/100
|
#43
Exceptional
11.9%
Tongans
99.2
/100
|
#44
Exceptional
11.9%
Immigrants | Czechoslovakia
99.2
/100
|
#45
Exceptional
11.9%
Turks
99.2
/100
|
#46
Exceptional
11.9%
Asians
99.1
/100
|
#47
Exceptional
11.9%
Immigrants | Japan
99.0
/100
|
#48
Exceptional
11.9%
Immigrants | Romania
99.0
/100
|
#49
Exceptional
12.0%
Slovenes
98.9
/100
|
#50
Exceptional
12.0%
Immigrants | Bulgaria
98.9
/100
|
#51
Exceptional
12.0%
Immigrants | Croatia
98.7
/100
|
#52
Exceptional
12.0%
Immigrants | Austria
98.7
/100
|
#53
Exceptional
12.0%
Immigrants | Philippines
98.7
/100
|
#54
Exceptional
12.1%
Immigrants | Sri Lanka
98.5
/100
|
#55
Exceptional
12.1%
Estonians
98.3
/100
|
#56
Exceptional
12.1%

Demographics Similar to Shoshone by Female Poverty

In terms of female poverty, the demographic groups most similar to Shoshone are Immigrants from Jamaica (15.6%, a difference of 0.060%), Cape Verdean (15.6%, a difference of 0.12%), Jamaican (15.5%, a difference of 0.19%), Immigrants from Guyana (15.6%, a difference of 0.19%), and Guyanese (15.6%, a difference of 0.29%).
DemographicsRating | RankFemale Poverty
Immigrants | Trinidad and Tobago
0.3
/100
|
#251
Tragic
15.4%
Immigrants | Burma/Myanmar
0.3
/100
|
#252
Tragic
15.4%
Liberians
0.2
/100
|
#253
Tragic
15.4%
Trinidadians and Tobagonians
0.2
/100
|
#254
Tragic
15.4%
Ottawa
0.2
/100
|
#255
Tragic
15.5%
Jamaicans
0.2
/100
|
#256
Tragic
15.5%
Immigrants | Jamaica
0.1
/100
|
#257
Tragic
15.6%
Shoshone
0.1
/100
|
#258
Tragic
15.6%
Cape Verdeans
0.1
/100
|
#259
Tragic
15.6%
Immigrants | Guyana
0.1
/100
|
#260
Tragic
15.6%
Guyanese
0.1
/100
|
#261
Tragic
15.6%
Mexican American Indians
0.1
/100
|
#262
Tragic
15.6%
Cherokee
0.1
/100
|
#263
Tragic
15.6%
Immigrants | Ecuador
0.1
/100
|
#264
Tragic
15.6%
Immigrants | Liberia
0.1
/100
|
#265
Tragic
15.7%