Immigrants from Panama vs Osage Single Father Poverty
COMPARE
Immigrants from Panama
Osage
Single Father Poverty
Single Father Poverty Comparison
Immigrants from Panama
Osage
15.9%
SINGLE FATHER POVERTY
91.3/ 100
METRIC RATING
124th/ 347
METRIC RANK
19.0%
SINGLE FATHER POVERTY
0.0/ 100
METRIC RATING
316th/ 347
METRIC RANK
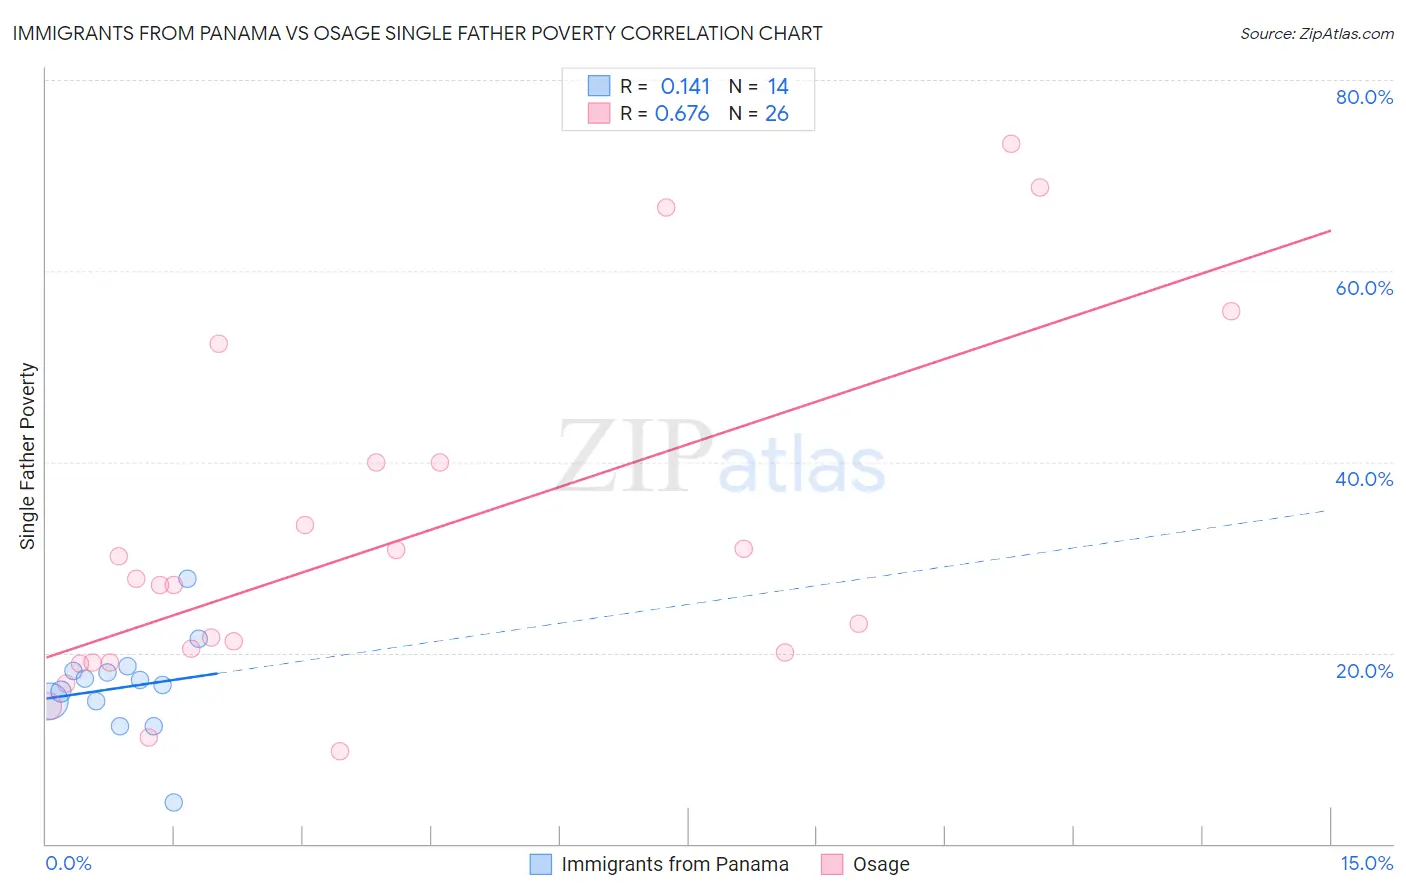
Immigrants from Panama vs Osage Single Father Poverty Correlation Chart
The statistical analysis conducted on geographies consisting of 190,509,085 people shows a poor positive correlation between the proportion of Immigrants from Panama and poverty level among single fathers in the United States with a correlation coefficient (R) of 0.141 and weighted average of 15.9%. Similarly, the statistical analysis conducted on geographies consisting of 82,975,637 people shows a significant positive correlation between the proportion of Osage and poverty level among single fathers in the United States with a correlation coefficient (R) of 0.676 and weighted average of 19.0%, a difference of 19.9%.
Single Father Poverty Correlation Summary
| Measurement | Immigrants from Panama | Osage |
| Minimum | 4.3% | 9.7% |
| Maximum | 27.8% | 73.3% |
| Range | 23.5% | 63.7% |
| Mean | 16.4% | 31.5% |
| Median | 16.9% | 27.1% |
| Interquartile 25% (IQ1) | 15.0% | 19.0% |
| Interquartile 75% (IQ3) | 18.1% | 40.0% |
| Interquartile Range (IQR) | 3.1% | 21.0% |
| Standard Deviation (Sample) | 5.2% | 17.9% |
| Standard Deviation (Population) | 5.0% | 17.5% |
Similar Demographics by Single Father Poverty
Demographics Similar to Immigrants from Panama by Single Father Poverty
In terms of single father poverty, the demographic groups most similar to Immigrants from Panama are Palestinian (15.9%, a difference of 0.010%), Iraqi (15.9%, a difference of 0.010%), Hmong (15.9%, a difference of 0.020%), Immigrants from Liberia (15.9%, a difference of 0.030%), and Sudanese (15.9%, a difference of 0.040%).
| Demographics | Rating | Rank | Single Father Poverty |
| Immigrants | Colombia | 92.6 /100 | #117 | Exceptional 15.8% |
| Immigrants | Eastern Europe | 92.5 /100 | #118 | Exceptional 15.8% |
| Immigrants | Belarus | 92.4 /100 | #119 | Exceptional 15.8% |
| Uruguayans | 92.1 /100 | #120 | Exceptional 15.9% |
| Immigrants | Immigrants | 91.9 /100 | #121 | Exceptional 15.9% |
| Sudanese | 91.6 /100 | #122 | Exceptional 15.9% |
| Palestinians | 91.3 /100 | #123 | Exceptional 15.9% |
| Immigrants | Panama | 91.3 /100 | #124 | Exceptional 15.9% |
| Iraqis | 91.2 /100 | #125 | Exceptional 15.9% |
| Hmong | 91.1 /100 | #126 | Exceptional 15.9% |
| Immigrants | Liberia | 91.1 /100 | #127 | Exceptional 15.9% |
| Immigrants | Nigeria | 90.8 /100 | #128 | Exceptional 15.9% |
| Immigrants | West Indies | 90.8 /100 | #129 | Exceptional 15.9% |
| Norwegians | 90.2 /100 | #130 | Exceptional 15.9% |
| Nicaraguans | 90.1 /100 | #131 | Exceptional 15.9% |
Demographics Similar to Osage by Single Father Poverty
In terms of single father poverty, the demographic groups most similar to Osage are Dominican (19.1%, a difference of 0.31%), Chickasaw (19.0%, a difference of 0.40%), Delaware (18.9%, a difference of 0.56%), Potawatomi (18.9%, a difference of 0.72%), and Dutch West Indian (19.2%, a difference of 0.89%).
| Demographics | Rating | Rank | Single Father Poverty |
| Immigrants | Micronesia | 0.0 /100 | #309 | Tragic 18.6% |
| Chippewa | 0.0 /100 | #310 | Tragic 18.8% |
| Immigrants | Nonimmigrants | 0.0 /100 | #311 | Tragic 18.8% |
| Immigrants | Dominica | 0.0 /100 | #312 | Tragic 18.9% |
| Potawatomi | 0.0 /100 | #313 | Tragic 18.9% |
| Delaware | 0.0 /100 | #314 | Tragic 18.9% |
| Chickasaw | 0.0 /100 | #315 | Tragic 19.0% |
| Osage | 0.0 /100 | #316 | Tragic 19.0% |
| Dominicans | 0.0 /100 | #317 | Tragic 19.1% |
| Dutch West Indians | 0.0 /100 | #318 | Tragic 19.2% |
| Slovaks | 0.0 /100 | #319 | Tragic 19.3% |
| Inupiat | 0.0 /100 | #320 | Tragic 19.5% |
| Cherokee | 0.0 /100 | #321 | Tragic 19.6% |
| Creek | 0.0 /100 | #322 | Tragic 19.8% |
| Pennsylvania Germans | 0.0 /100 | #323 | Tragic 20.0% |