Immigrants from Panama vs Immigrants from Belize Female Poverty Among 25-34 Year Olds
COMPARE
Immigrants from Panama
Immigrants from Belize
Female Poverty Among 25-34 Year Olds
Female Poverty Among 25-34 Year Olds Comparison
Immigrants from Panama
Immigrants from Belize
14.1%
FEMALE POVERTY AMONG 25-34 YEAR OLDS
11.6/ 100
METRIC RATING
208th/ 347
METRIC RANK
15.3%
FEMALE POVERTY AMONG 25-34 YEAR OLDS
0.2/ 100
METRIC RATING
262nd/ 347
METRIC RANK
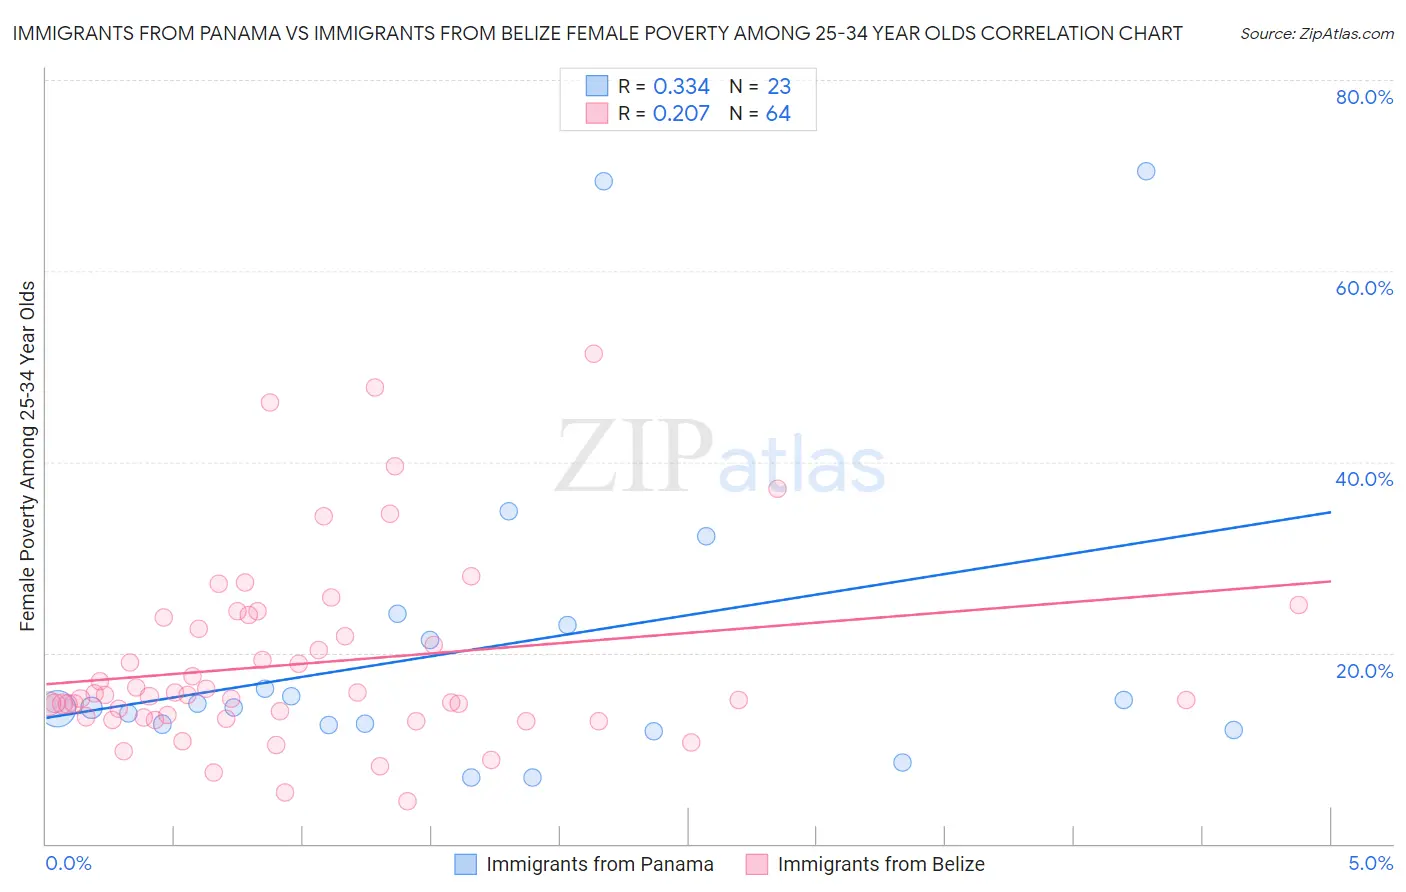
Immigrants from Panama vs Immigrants from Belize Female Poverty Among 25-34 Year Olds Correlation Chart
The statistical analysis conducted on geographies consisting of 219,926,572 people shows a mild positive correlation between the proportion of Immigrants from Panama and poverty level among females between the ages 25 and 34 in the United States with a correlation coefficient (R) of 0.334 and weighted average of 14.1%. Similarly, the statistical analysis conducted on geographies consisting of 129,916,036 people shows a weak positive correlation between the proportion of Immigrants from Belize and poverty level among females between the ages 25 and 34 in the United States with a correlation coefficient (R) of 0.207 and weighted average of 15.3%, a difference of 8.6%.
Female Poverty Among 25-34 Year Olds Correlation Summary
| Measurement | Immigrants from Panama | Immigrants from Belize |
| Minimum | 7.0% | 4.5% |
| Maximum | 70.5% | 51.4% |
| Range | 63.5% | 46.9% |
| Mean | 20.7% | 18.9% |
| Median | 14.3% | 15.5% |
| Interquartile 25% (IQ1) | 12.4% | 13.2% |
| Interquartile 75% (IQ3) | 22.9% | 23.1% |
| Interquartile Range (IQR) | 10.5% | 9.9% |
| Standard Deviation (Sample) | 17.0% | 9.7% |
| Standard Deviation (Population) | 16.7% | 9.7% |
Similar Demographics by Female Poverty Among 25-34 Year Olds
Demographics Similar to Immigrants from Panama by Female Poverty Among 25-34 Year Olds
In terms of female poverty among 25-34 year olds, the demographic groups most similar to Immigrants from Panama are Japanese (14.1%, a difference of 0.020%), Hungarian (14.1%, a difference of 0.040%), Immigrants from Africa (14.1%, a difference of 0.32%), Hawaiian (14.1%, a difference of 0.37%), and Immigrants (14.0%, a difference of 0.51%).
| Demographics | Rating | Rank | Female Poverty Among 25-34 Year Olds |
| Immigrants | Trinidad and Tobago | 17.6 /100 | #201 | Poor 14.0% |
| Welsh | 17.2 /100 | #202 | Poor 14.0% |
| Immigrants | Immigrants | 14.5 /100 | #203 | Poor 14.0% |
| Hawaiians | 13.6 /100 | #204 | Poor 14.1% |
| Immigrants | Africa | 13.4 /100 | #205 | Poor 14.1% |
| Hungarians | 11.8 /100 | #206 | Poor 14.1% |
| Japanese | 11.7 /100 | #207 | Poor 14.1% |
| Immigrants | Panama | 11.6 /100 | #208 | Poor 14.1% |
| Guyanese | 8.6 /100 | #209 | Tragic 14.2% |
| Panamanians | 8.6 /100 | #210 | Tragic 14.2% |
| Trinidadians and Tobagonians | 8.2 /100 | #211 | Tragic 14.2% |
| Immigrants | Guyana | 6.6 /100 | #212 | Tragic 14.3% |
| Puget Sound Salish | 6.5 /100 | #213 | Tragic 14.3% |
| French | 6.2 /100 | #214 | Tragic 14.3% |
| Immigrants | Nigeria | 6.2 /100 | #215 | Tragic 14.3% |
Demographics Similar to Immigrants from Belize by Female Poverty Among 25-34 Year Olds
In terms of female poverty among 25-34 year olds, the demographic groups most similar to Immigrants from Belize are Liberian (15.3%, a difference of 0.040%), Mexican American Indian (15.4%, a difference of 0.24%), Marshallese (15.3%, a difference of 0.26%), Immigrants from Cuba (15.2%, a difference of 0.63%), and Nepalese (15.2%, a difference of 0.65%).
| Demographics | Rating | Rank | Female Poverty Among 25-34 Year Olds |
| Immigrants | Laos | 0.3 /100 | #255 | Tragic 15.2% |
| West Indians | 0.3 /100 | #256 | Tragic 15.2% |
| Immigrants | Burma/Myanmar | 0.3 /100 | #257 | Tragic 15.2% |
| Nepalese | 0.2 /100 | #258 | Tragic 15.2% |
| Immigrants | Cuba | 0.2 /100 | #259 | Tragic 15.2% |
| Marshallese | 0.2 /100 | #260 | Tragic 15.3% |
| Liberians | 0.2 /100 | #261 | Tragic 15.3% |
| Immigrants | Belize | 0.2 /100 | #262 | Tragic 15.3% |
| Mexican American Indians | 0.2 /100 | #263 | Tragic 15.4% |
| Pennsylvania Germans | 0.1 /100 | #264 | Tragic 15.4% |
| Immigrants | Liberia | 0.1 /100 | #265 | Tragic 15.4% |
| Immigrants | Somalia | 0.1 /100 | #266 | Tragic 15.4% |
| Central Americans | 0.1 /100 | #267 | Tragic 15.5% |
| Immigrants | Senegal | 0.1 /100 | #268 | Tragic 15.6% |
| Sub-Saharan Africans | 0.1 /100 | #269 | Tragic 15.6% |