Immigrants from Eastern Africa vs Immigrants from Belize Female Poverty Among 25-34 Year Olds
COMPARE
Immigrants from Eastern Africa
Immigrants from Belize
Female Poverty Among 25-34 Year Olds
Female Poverty Among 25-34 Year Olds Comparison
Immigrants from Eastern Africa
Immigrants from Belize
13.6%
FEMALE POVERTY AMONG 25-34 YEAR OLDS
43.6/ 100
METRIC RATING
179th/ 347
METRIC RANK
15.3%
FEMALE POVERTY AMONG 25-34 YEAR OLDS
0.2/ 100
METRIC RATING
262nd/ 347
METRIC RANK
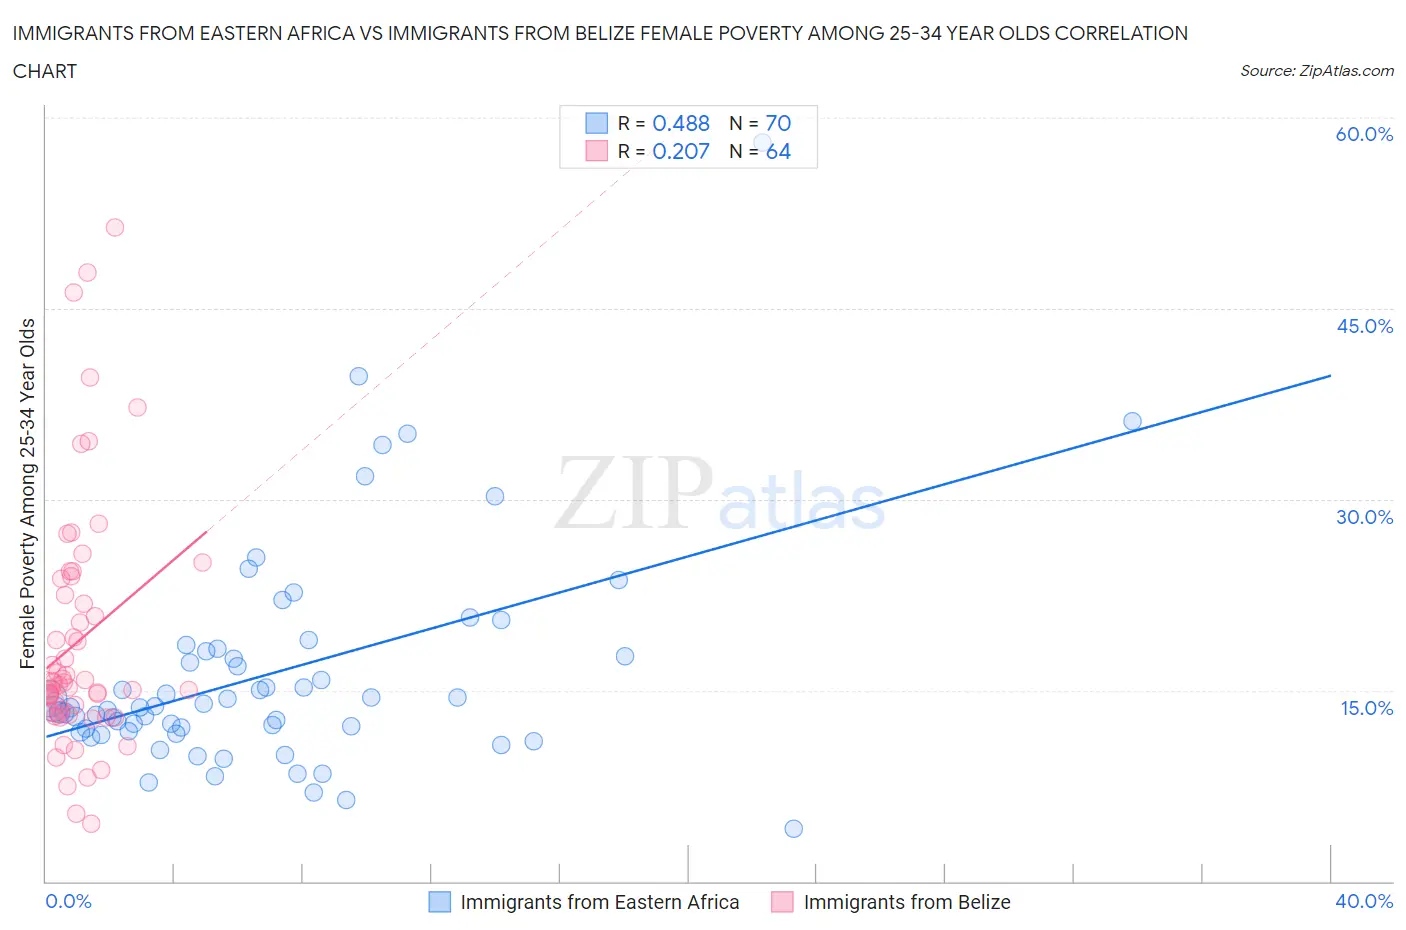
Immigrants from Eastern Africa vs Immigrants from Belize Female Poverty Among 25-34 Year Olds Correlation Chart
The statistical analysis conducted on geographies consisting of 350,717,935 people shows a moderate positive correlation between the proportion of Immigrants from Eastern Africa and poverty level among females between the ages 25 and 34 in the United States with a correlation coefficient (R) of 0.488 and weighted average of 13.6%. Similarly, the statistical analysis conducted on geographies consisting of 129,916,036 people shows a weak positive correlation between the proportion of Immigrants from Belize and poverty level among females between the ages 25 and 34 in the United States with a correlation coefficient (R) of 0.207 and weighted average of 15.3%, a difference of 12.6%.
Female Poverty Among 25-34 Year Olds Correlation Summary
| Measurement | Immigrants from Eastern Africa | Immigrants from Belize |
| Minimum | 4.1% | 4.5% |
| Maximum | 58.1% | 51.4% |
| Range | 53.9% | 46.9% |
| Mean | 16.4% | 18.9% |
| Median | 13.7% | 15.5% |
| Interquartile 25% (IQ1) | 11.8% | 13.2% |
| Interquartile 75% (IQ3) | 18.1% | 23.1% |
| Interquartile Range (IQR) | 6.3% | 9.9% |
| Standard Deviation (Sample) | 8.8% | 9.7% |
| Standard Deviation (Population) | 8.7% | 9.7% |
Similar Demographics by Female Poverty Among 25-34 Year Olds
Demographics Similar to Immigrants from Eastern Africa by Female Poverty Among 25-34 Year Olds
In terms of female poverty among 25-34 year olds, the demographic groups most similar to Immigrants from Eastern Africa are Canadian (13.6%, a difference of 0.060%), Venezuelan (13.6%, a difference of 0.090%), Yugoslavian (13.6%, a difference of 0.12%), German (13.6%, a difference of 0.17%), and Guamanian/Chamorro (13.6%, a difference of 0.17%).
| Demographics | Rating | Rank | Female Poverty Among 25-34 Year Olds |
| Immigrants | Costa Rica | 51.9 /100 | #172 | Average 13.5% |
| Kenyans | 51.8 /100 | #173 | Average 13.5% |
| Immigrants | Oceania | 50.0 /100 | #174 | Average 13.5% |
| Bermudans | 46.8 /100 | #175 | Average 13.6% |
| Yugoslavians | 45.0 /100 | #176 | Average 13.6% |
| Venezuelans | 44.6 /100 | #177 | Average 13.6% |
| Canadians | 44.3 /100 | #178 | Average 13.6% |
| Immigrants | Eastern Africa | 43.6 /100 | #179 | Average 13.6% |
| Germans | 41.6 /100 | #180 | Average 13.6% |
| Guamanians/Chamorros | 41.5 /100 | #181 | Average 13.6% |
| Immigrants | Venezuela | 40.7 /100 | #182 | Average 13.6% |
| Portuguese | 40.3 /100 | #183 | Average 13.6% |
| Czechoslovakians | 36.8 /100 | #184 | Fair 13.7% |
| Irish | 35.3 /100 | #185 | Fair 13.7% |
| Immigrants | Uruguay | 34.1 /100 | #186 | Fair 13.7% |
Demographics Similar to Immigrants from Belize by Female Poverty Among 25-34 Year Olds
In terms of female poverty among 25-34 year olds, the demographic groups most similar to Immigrants from Belize are Liberian (15.3%, a difference of 0.040%), Mexican American Indian (15.4%, a difference of 0.24%), Marshallese (15.3%, a difference of 0.26%), Immigrants from Cuba (15.2%, a difference of 0.63%), and Nepalese (15.2%, a difference of 0.65%).
| Demographics | Rating | Rank | Female Poverty Among 25-34 Year Olds |
| Immigrants | Laos | 0.3 /100 | #255 | Tragic 15.2% |
| West Indians | 0.3 /100 | #256 | Tragic 15.2% |
| Immigrants | Burma/Myanmar | 0.3 /100 | #257 | Tragic 15.2% |
| Nepalese | 0.2 /100 | #258 | Tragic 15.2% |
| Immigrants | Cuba | 0.2 /100 | #259 | Tragic 15.2% |
| Marshallese | 0.2 /100 | #260 | Tragic 15.3% |
| Liberians | 0.2 /100 | #261 | Tragic 15.3% |
| Immigrants | Belize | 0.2 /100 | #262 | Tragic 15.3% |
| Mexican American Indians | 0.2 /100 | #263 | Tragic 15.4% |
| Pennsylvania Germans | 0.1 /100 | #264 | Tragic 15.4% |
| Immigrants | Liberia | 0.1 /100 | #265 | Tragic 15.4% |
| Immigrants | Somalia | 0.1 /100 | #266 | Tragic 15.4% |
| Central Americans | 0.1 /100 | #267 | Tragic 15.5% |
| Immigrants | Senegal | 0.1 /100 | #268 | Tragic 15.6% |
| Sub-Saharan Africans | 0.1 /100 | #269 | Tragic 15.6% |