Immigrants from Pakistan vs Mongolian Seniors Poverty Over the Age of 65
COMPARE
Immigrants from Pakistan
Mongolian
Seniors Poverty Over the Age of 65
Seniors Poverty Over the Age of 65 Comparison
Immigrants from Pakistan
Mongolians
10.2%
SENIORS POVERTY OVER THE AGE OF 65
95.7/ 100
METRIC RATING
97th/ 347
METRIC RANK
10.9%
SENIORS POVERTY OVER THE AGE OF 65
58.0/ 100
METRIC RATING
168th/ 347
METRIC RANK
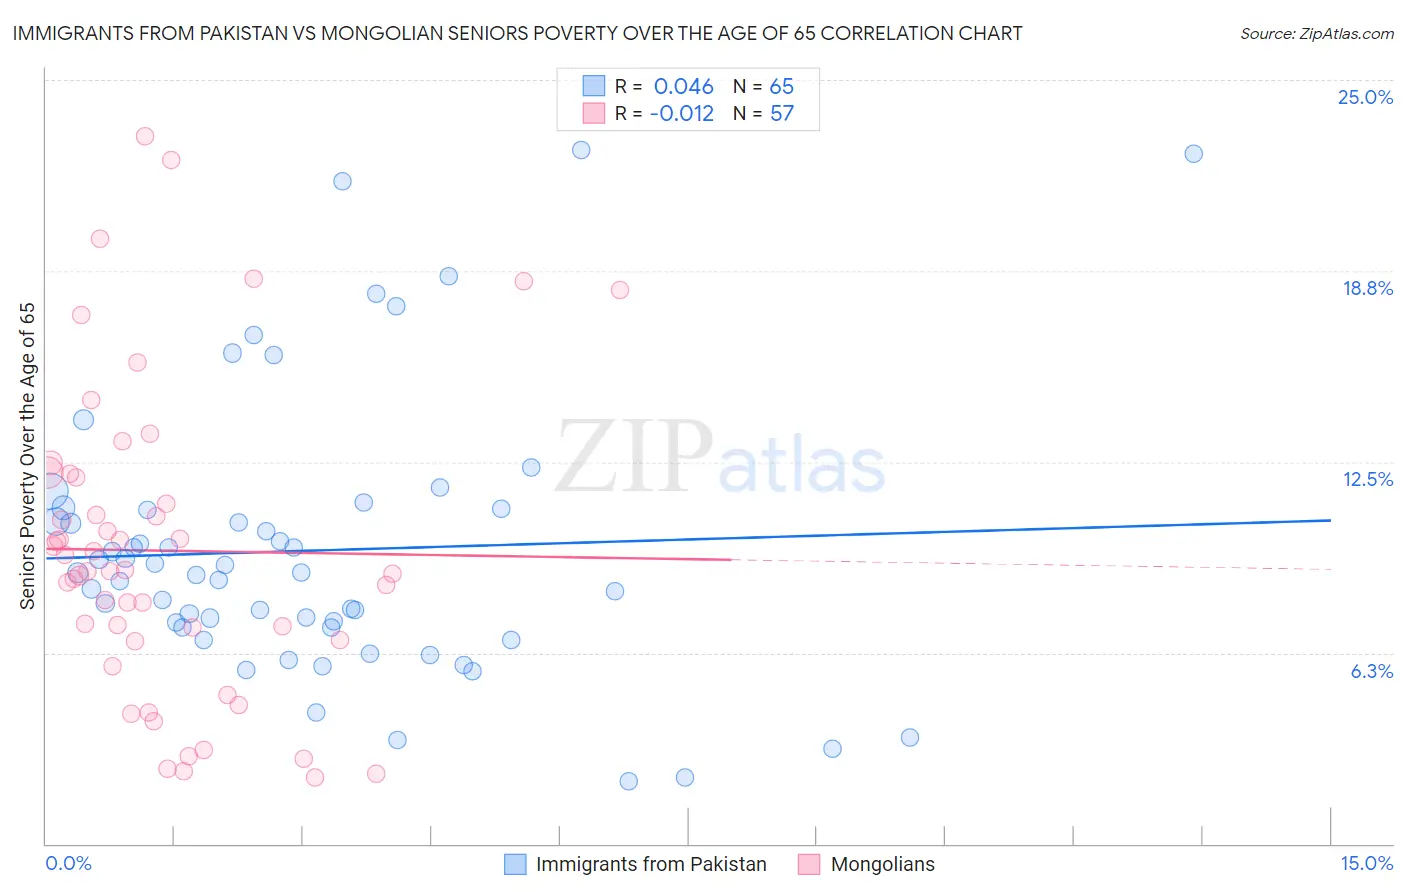
Immigrants from Pakistan vs Mongolian Seniors Poverty Over the Age of 65 Correlation Chart
The statistical analysis conducted on geographies consisting of 283,278,870 people shows no correlation between the proportion of Immigrants from Pakistan and poverty level among seniors over the age of 65 in the United States with a correlation coefficient (R) of 0.046 and weighted average of 10.2%. Similarly, the statistical analysis conducted on geographies consisting of 140,162,165 people shows no correlation between the proportion of Mongolians and poverty level among seniors over the age of 65 in the United States with a correlation coefficient (R) of -0.012 and weighted average of 10.9%, a difference of 6.7%.
Seniors Poverty Over the Age of 65 Correlation Summary
| Measurement | Immigrants from Pakistan | Mongolian |
| Minimum | 2.1% | 2.2% |
| Maximum | 22.7% | 23.2% |
| Range | 20.6% | 21.0% |
| Mean | 9.6% | 9.6% |
| Median | 8.9% | 8.9% |
| Interquartile 25% (IQ1) | 7.1% | 6.7% |
| Interquartile 75% (IQ3) | 11.0% | 12.1% |
| Interquartile Range (IQR) | 3.9% | 5.4% |
| Standard Deviation (Sample) | 4.5% | 5.0% |
| Standard Deviation (Population) | 4.5% | 5.0% |
Similar Demographics by Seniors Poverty Over the Age of 65
Demographics Similar to Immigrants from Pakistan by Seniors Poverty Over the Age of 65
In terms of seniors poverty over the age of 65, the demographic groups most similar to Immigrants from Pakistan are Basque (10.2%, a difference of 0.090%), Immigrants from Kuwait (10.2%, a difference of 0.16%), Cypriot (10.2%, a difference of 0.16%), Marshallese (10.2%, a difference of 0.23%), and Immigrants from Japan (10.1%, a difference of 0.37%).
| Demographics | Rating | Rank | Seniors Poverty Over the Age of 65 |
| Ukrainians | 96.9 /100 | #90 | Exceptional 10.1% |
| Puget Sound Salish | 96.9 /100 | #91 | Exceptional 10.1% |
| Immigrants | Singapore | 96.9 /100 | #92 | Exceptional 10.1% |
| Immigrants | Sweden | 96.7 /100 | #93 | Exceptional 10.1% |
| Immigrants | Germany | 96.7 /100 | #94 | Exceptional 10.1% |
| Immigrants | Japan | 96.3 /100 | #95 | Exceptional 10.1% |
| Basques | 95.9 /100 | #96 | Exceptional 10.2% |
| Immigrants | Pakistan | 95.7 /100 | #97 | Exceptional 10.2% |
| Immigrants | Kuwait | 95.5 /100 | #98 | Exceptional 10.2% |
| Cypriots | 95.5 /100 | #99 | Exceptional 10.2% |
| Marshallese | 95.3 /100 | #100 | Exceptional 10.2% |
| Immigrants | Jordan | 94.7 /100 | #101 | Exceptional 10.2% |
| Delaware | 94.5 /100 | #102 | Exceptional 10.2% |
| Icelanders | 94.4 /100 | #103 | Exceptional 10.3% |
| South Africans | 94.3 /100 | #104 | Exceptional 10.3% |
Demographics Similar to Mongolians by Seniors Poverty Over the Age of 65
In terms of seniors poverty over the age of 65, the demographic groups most similar to Mongolians are Sri Lankan (10.9%, a difference of 0.10%), Immigrants from Eastern Europe (10.9%, a difference of 0.20%), Alaska Native (10.8%, a difference of 0.22%), Nonimmigrants (10.9%, a difference of 0.26%), and Immigrants from Syria (10.9%, a difference of 0.30%).
| Demographics | Rating | Rank | Seniors Poverty Over the Age of 65 |
| Arabs | 65.2 /100 | #161 | Good 10.8% |
| Immigrants | Indonesia | 64.8 /100 | #162 | Good 10.8% |
| Tsimshian | 64.5 /100 | #163 | Good 10.8% |
| Potawatomi | 62.6 /100 | #164 | Good 10.8% |
| Immigrants | South Eastern Asia | 62.1 /100 | #165 | Good 10.8% |
| Malaysians | 62.0 /100 | #166 | Good 10.8% |
| Alaska Natives | 60.3 /100 | #167 | Good 10.8% |
| Mongolians | 58.0 /100 | #168 | Average 10.9% |
| Sri Lankans | 56.8 /100 | #169 | Average 10.9% |
| Immigrants | Eastern Europe | 55.8 /100 | #170 | Average 10.9% |
| Immigrants | Nonimmigrants | 55.1 /100 | #171 | Average 10.9% |
| Immigrants | Syria | 54.7 /100 | #172 | Average 10.9% |
| Spaniards | 50.7 /100 | #173 | Average 10.9% |
| Immigrants | Sudan | 50.0 /100 | #174 | Average 10.9% |
| Creek | 49.6 /100 | #175 | Average 10.9% |