Immigrants from Pakistan vs Immigrants from Taiwan Seniors Poverty Over the Age of 65
COMPARE
Immigrants from Pakistan
Immigrants from Taiwan
Seniors Poverty Over the Age of 65
Seniors Poverty Over the Age of 65 Comparison
Immigrants from Pakistan
Immigrants from Taiwan
10.2%
SENIORS POVERTY OVER THE AGE OF 65
95.7/ 100
METRIC RATING
97th/ 347
METRIC RANK
9.7%
SENIORS POVERTY OVER THE AGE OF 65
99.5/ 100
METRIC RATING
46th/ 347
METRIC RANK
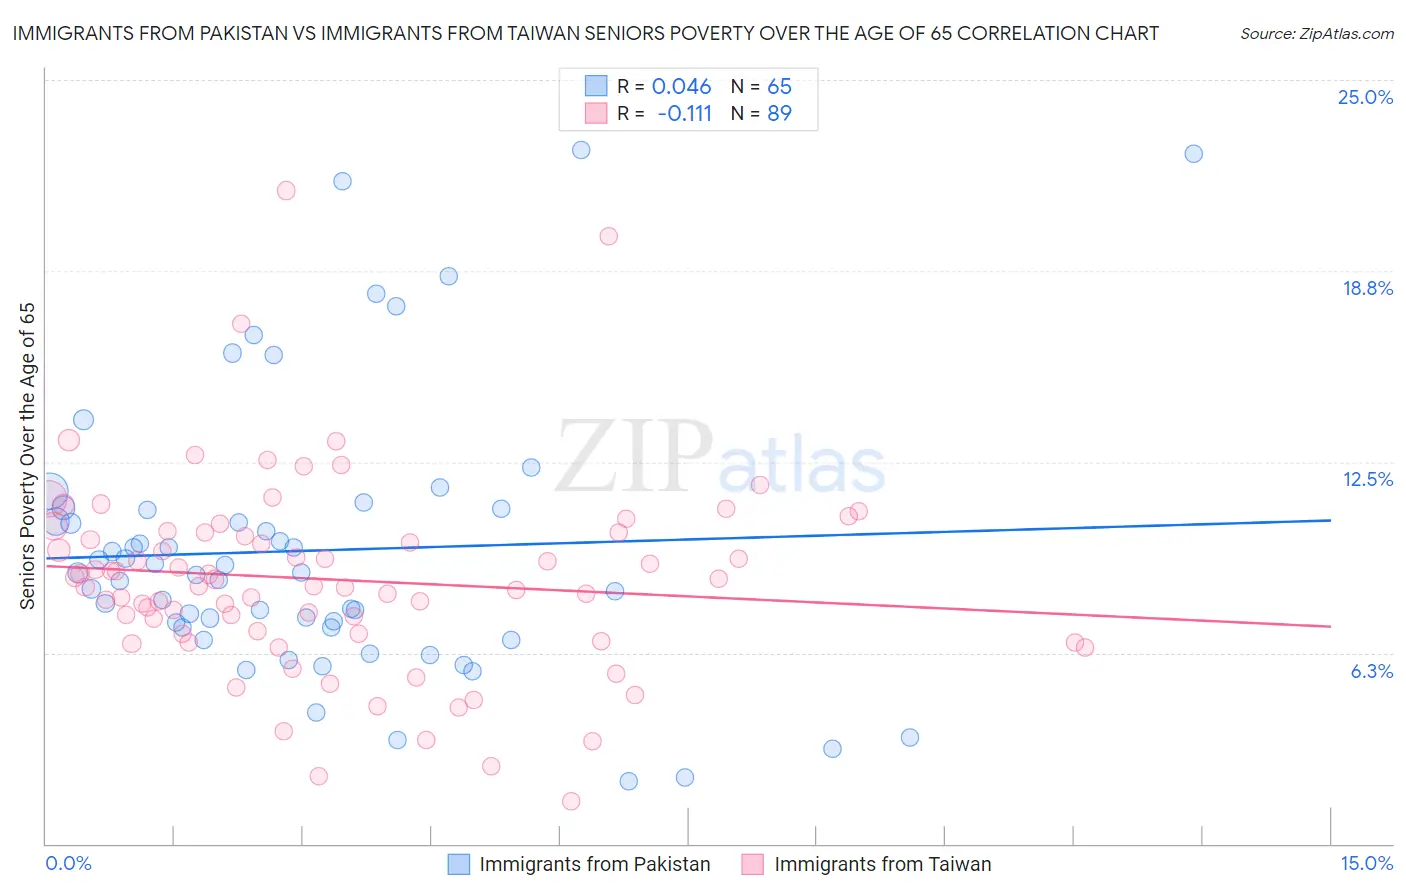
Immigrants from Pakistan vs Immigrants from Taiwan Seniors Poverty Over the Age of 65 Correlation Chart
The statistical analysis conducted on geographies consisting of 283,278,870 people shows no correlation between the proportion of Immigrants from Pakistan and poverty level among seniors over the age of 65 in the United States with a correlation coefficient (R) of 0.046 and weighted average of 10.2%. Similarly, the statistical analysis conducted on geographies consisting of 297,603,388 people shows a poor negative correlation between the proportion of Immigrants from Taiwan and poverty level among seniors over the age of 65 in the United States with a correlation coefficient (R) of -0.111 and weighted average of 9.7%, a difference of 5.4%.
Seniors Poverty Over the Age of 65 Correlation Summary
| Measurement | Immigrants from Pakistan | Immigrants from Taiwan |
| Minimum | 2.1% | 1.4% |
| Maximum | 22.7% | 21.4% |
| Range | 20.6% | 20.0% |
| Mean | 9.6% | 8.6% |
| Median | 8.9% | 8.4% |
| Interquartile 25% (IQ1) | 7.1% | 6.9% |
| Interquartile 75% (IQ3) | 11.0% | 10.2% |
| Interquartile Range (IQR) | 3.9% | 3.3% |
| Standard Deviation (Sample) | 4.5% | 3.2% |
| Standard Deviation (Population) | 4.5% | 3.2% |
Similar Demographics by Seniors Poverty Over the Age of 65
Demographics Similar to Immigrants from Pakistan by Seniors Poverty Over the Age of 65
In terms of seniors poverty over the age of 65, the demographic groups most similar to Immigrants from Pakistan are Basque (10.2%, a difference of 0.090%), Immigrants from Kuwait (10.2%, a difference of 0.16%), Cypriot (10.2%, a difference of 0.16%), Marshallese (10.2%, a difference of 0.23%), and Immigrants from Japan (10.1%, a difference of 0.37%).
| Demographics | Rating | Rank | Seniors Poverty Over the Age of 65 |
| Ukrainians | 96.9 /100 | #90 | Exceptional 10.1% |
| Puget Sound Salish | 96.9 /100 | #91 | Exceptional 10.1% |
| Immigrants | Singapore | 96.9 /100 | #92 | Exceptional 10.1% |
| Immigrants | Sweden | 96.7 /100 | #93 | Exceptional 10.1% |
| Immigrants | Germany | 96.7 /100 | #94 | Exceptional 10.1% |
| Immigrants | Japan | 96.3 /100 | #95 | Exceptional 10.1% |
| Basques | 95.9 /100 | #96 | Exceptional 10.2% |
| Immigrants | Pakistan | 95.7 /100 | #97 | Exceptional 10.2% |
| Immigrants | Kuwait | 95.5 /100 | #98 | Exceptional 10.2% |
| Cypriots | 95.5 /100 | #99 | Exceptional 10.2% |
| Marshallese | 95.3 /100 | #100 | Exceptional 10.2% |
| Immigrants | Jordan | 94.7 /100 | #101 | Exceptional 10.2% |
| Delaware | 94.5 /100 | #102 | Exceptional 10.2% |
| Icelanders | 94.4 /100 | #103 | Exceptional 10.3% |
| South Africans | 94.3 /100 | #104 | Exceptional 10.3% |
Demographics Similar to Immigrants from Taiwan by Seniors Poverty Over the Age of 65
In terms of seniors poverty over the age of 65, the demographic groups most similar to Immigrants from Taiwan are Immigrants from South Central Asia (9.7%, a difference of 0.010%), French (9.7%, a difference of 0.12%), Estonian (9.6%, a difference of 0.14%), Immigrants from Lithuania (9.7%, a difference of 0.18%), and Austrian (9.6%, a difference of 0.32%).
| Demographics | Rating | Rank | Seniors Poverty Over the Age of 65 |
| Greeks | 99.6 /100 | #39 | Exceptional 9.6% |
| Assyrians/Chaldeans/Syriacs | 99.6 /100 | #40 | Exceptional 9.6% |
| Immigrants | North Macedonia | 99.6 /100 | #41 | Exceptional 9.6% |
| Zimbabweans | 99.6 /100 | #42 | Exceptional 9.6% |
| Eastern Europeans | 99.6 /100 | #43 | Exceptional 9.6% |
| Austrians | 99.5 /100 | #44 | Exceptional 9.6% |
| Estonians | 99.5 /100 | #45 | Exceptional 9.6% |
| Immigrants | Taiwan | 99.5 /100 | #46 | Exceptional 9.7% |
| Immigrants | South Central Asia | 99.5 /100 | #47 | Exceptional 9.7% |
| French | 99.5 /100 | #48 | Exceptional 9.7% |
| Immigrants | Lithuania | 99.4 /100 | #49 | Exceptional 9.7% |
| Hungarians | 99.4 /100 | #50 | Exceptional 9.7% |
| Carpatho Rusyns | 99.3 /100 | #51 | Exceptional 9.7% |
| Filipinos | 99.3 /100 | #52 | Exceptional 9.7% |
| Slavs | 99.2 /100 | #53 | Exceptional 9.8% |