Immigrants from Oceania vs Immigrants from Russia Child Poverty Among Girls Under 16

COMPARE

Immigrants from Oceania
Race
Ancestry
AfghanAfricanAlaska NativeAlaskan AthabascanAlbanianAleutAlsatianAmericanApacheArabArapahoArgentineanArmenianAssyrian/Chaldean/SyriacAustralianAustrianBahamianBangladeshiBarbadianBasqueBelgianBelizeanBermudanBhutaneseBlackfeetBolivianBrazilianBritishBritish West IndianBulgarianBurmeseCajunCambodianCanadianCape VerdeanCarpatho RusynCelticCentral AmericanCentral American IndianCherokeeCheyenneChickasawChileanChineseChippewaChoctawColombianColvilleComancheCosta RicanCreeCreekCroatianCrowCubanCypriotCzechCzechoslovakianDanishDelawareDominicanDutchDutch West IndianEastern EuropeanEcuadorianEgyptianEnglishEstonianEthiopianEuropeanFijianFilipinoFinnishFrenchFrench American IndianFrench CanadianGermanGerman RussianGhanaianGreekGuamanian/ChamorroGuatemalanGuyaneseHaitianHmongHonduranHopiHoumaHungarianIcelanderIndian (Asian)IndonesianInupiatIranianIraqiIrishIroquoisIsraeliItalianJamaicanJapaneseJordanianKenyanKiowaKoreanLaotianLatvianLebaneseLiberianLithuanianLumbeeLuxembourgerMacedonianMalaysianMalteseMarshalleseMenomineeMexicanMexican American IndianMongolianMoroccanNative HawaiianNavajoNepaleseNew ZealanderNicaraguanNigerianNorthern EuropeanNorwegianOkinawanOsageOttawaPaiutePakistaniPalestinianPanamanianParaguayanPennsylvania GermanPeruvianPimaPolishPortuguesePotawatomiPuebloPuerto RicanPuget Sound SalishRomanianRussianSalvadoranSamoanScandinavianScotch-IrishScottishSeminoleSenegaleseSerbianShoshoneSierra LeoneanSiouxSlavicSlovakSloveneSomaliSouth AfricanSouth AmericanSouth American IndianSoviet UnionSpaniardSpanishSpanish AmericanSpanish American IndianSri LankanSubsaharan AfricanSudaneseSwedishSwissSyrianTaiwaneseThaiTlingit-HaidaTohono O'OdhamTonganTrinidadian and TobagonianTsimshianTurkishU.S. Virgin IslanderUgandanUkrainianUruguayanUteVenezuelanVietnameseWelshWest IndianYakamaYaquiYugoslavianYumanYup'ikZimbabwean
Immigration
NonimmigrantsImmigrantsAfghanistanAfricaAlbaniaArgentinaArmeniaAsiaAustraliaAustriaBahamasBangladeshBarbadosBelarusBelgiumBelizeBoliviaBosnia and HerzegovinaBrazilBulgariaBurma/MyanmarCabo VerdeCambodiaCameroonCanadaCaribbeanCentral AmericaChileChinaColombiaCongoCosta RicaCroatiaCubaCzechoslovakiaDenmarkDominicaDominican RepublicEastern AfricaEastern AsiaEastern EuropeEcuadorEgyptEl SalvadorEnglandEritreaEthiopiaEuropeFijiFranceGermanyGhanaGreeceGrenadaGuatemalaGuyanaHaitiHondurasHong KongHungaryIndiaIndonesiaIranIraqIrelandIsraelItalyJamaicaJapanJordanKazakhstanKenyaKoreaKuwaitLaosLatin AmericaLatviaLebanonLiberiaLithuaniaMalaysiaMexicoMicronesiaMiddle AfricaMoldovaMoroccoNepalNetherlandsNicaraguaNigeriaNorth AmericaNorth MacedoniaNorthern AfricaNorthern EuropeNorwayOceaniaPakistanPanamaPeruPhilippinesPolandPortugalRomaniaSaudi ArabiaScotlandSenegalSerbiaSierra LeoneSingaporeSomaliaSouth AfricaSouth AmericaSouth Central AsiaSouth Eastern AsiaSouthern EuropeSpainSri LankaSt. Vincent and the GrenadinesSudanSwedenSwitzerlandSyriaTaiwanThailandTrinidad and TobagoTurkeyUgandaUkraineUruguayUzbekistanVenezuelaVietnamWest IndiesWestern AfricaWestern AsiaWestern EuropeYemenZaireZimbabweAzores
Immigrants from Russia
Race
Ancestry
AfghanAfricanAlaska NativeAlaskan AthabascanAlbanianAleutAlsatianAmericanApacheArabArapahoArgentineanArmenianAssyrian/Chaldean/SyriacAustralianAustrianBahamianBangladeshiBarbadianBasqueBelgianBelizeanBermudanBhutaneseBlackfeetBolivianBrazilianBritishBritish West IndianBulgarianBurmeseCajunCambodianCanadianCape VerdeanCarpatho RusynCelticCentral AmericanCentral American IndianCherokeeCheyenneChickasawChileanChineseChippewaChoctawColombianColvilleComancheCosta RicanCreeCreekCroatianCrowCubanCypriotCzechCzechoslovakianDanishDelawareDominicanDutchDutch West IndianEastern EuropeanEcuadorianEgyptianEnglishEstonianEthiopianEuropeanFijianFilipinoFinnishFrenchFrench American IndianFrench CanadianGermanGerman RussianGhanaianGreekGuamanian/ChamorroGuatemalanGuyaneseHaitianHmongHonduranHopiHoumaHungarianIcelanderIndian (Asian)IndonesianInupiatIranianIraqiIrishIroquoisIsraeliItalianJamaicanJapaneseJordanianKenyanKiowaKoreanLaotianLatvianLebaneseLiberianLithuanianLumbeeLuxembourgerMacedonianMalaysianMalteseMarshalleseMenomineeMexicanMexican American IndianMongolianMoroccanNative HawaiianNavajoNepaleseNew ZealanderNicaraguanNigerianNorthern EuropeanNorwegianOkinawanOsageOttawaPaiutePakistaniPalestinianPanamanianParaguayanPennsylvania GermanPeruvianPimaPolishPortuguesePotawatomiPuebloPuerto RicanPuget Sound SalishRomanianRussianSalvadoranSamoanScandinavianScotch-IrishScottishSeminoleSenegaleseSerbianShoshoneSierra LeoneanSiouxSlavicSlovakSloveneSomaliSouth AfricanSouth AmericanSouth American IndianSoviet UnionSpaniardSpanishSpanish AmericanSpanish American IndianSri LankanSubsaharan AfricanSudaneseSwedishSwissSyrianTaiwaneseThaiTlingit-HaidaTohono O'OdhamTonganTrinidadian and TobagonianTsimshianTurkishU.S. Virgin IslanderUgandanUkrainianUruguayanUteVenezuelanVietnameseWelshWest IndianYakamaYaquiYugoslavianYumanYup'ikZimbabwean
Immigration
NonimmigrantsImmigrantsAfghanistanAfricaAlbaniaArgentinaArmeniaAsiaAustraliaAustriaBahamasBangladeshBarbadosBelarusBelgiumBelizeBoliviaBosnia and HerzegovinaBrazilBulgariaBurma/MyanmarCabo VerdeCambodiaCameroonCanadaCaribbeanCentral AmericaChileChinaColombiaCongoCosta RicaCroatiaCubaCzechoslovakiaDenmarkDominicaDominican RepublicEastern AfricaEastern AsiaEastern EuropeEcuadorEgyptEl SalvadorEnglandEritreaEthiopiaEuropeFijiFranceGermanyGhanaGreeceGrenadaGuatemalaGuyanaHaitiHondurasHong KongHungaryIndiaIndonesiaIranIraqIrelandIsraelItalyJamaicaJapanJordanKazakhstanKenyaKoreaKuwaitLaosLatin AmericaLatviaLebanonLiberiaLithuaniaMalaysiaMexicoMicronesiaMiddle AfricaMoldovaMoroccoNepalNetherlandsNicaraguaNigeriaNorth AmericaNorth MacedoniaNorthern AfricaNorthern EuropeNorwayPakistanPanamaPeruPhilippinesPolandPortugalRomaniaRussiaSaudi ArabiaScotlandSenegalSerbiaSierra LeoneSingaporeSomaliaSouth AfricaSouth AmericaSouth Central AsiaSouth Eastern AsiaSouthern EuropeSpainSri LankaSt. Vincent and the GrenadinesSudanSwedenSwitzerlandSyriaTaiwanThailandTrinidad and TobagoTurkeyUgandaUkraineUruguayUzbekistanVenezuelaVietnamWest IndiesWestern AfricaWestern AsiaWestern EuropeYemenZaireZimbabweAzores
Child Poverty Among Girls Under 16
Income
Poverty
Unemployment
Labor Participation
Family Structure
Vehicle Availability
Education Level
Disability

Child Poverty Among Girls Under 16 Comparison

Immigrants from Oceania

Immigrants from Russia

Good
Exceptional
16.1%
CHILD POVERTY AMONG GIRLS UNDER 16
68.4/ 100
METRIC RATING
163rd/ 347
METRIC RANK
14.7%
CHILD POVERTY AMONG GIRLS UNDER 16
97.9/ 100
METRIC RATING
76th/ 347
METRIC RANK

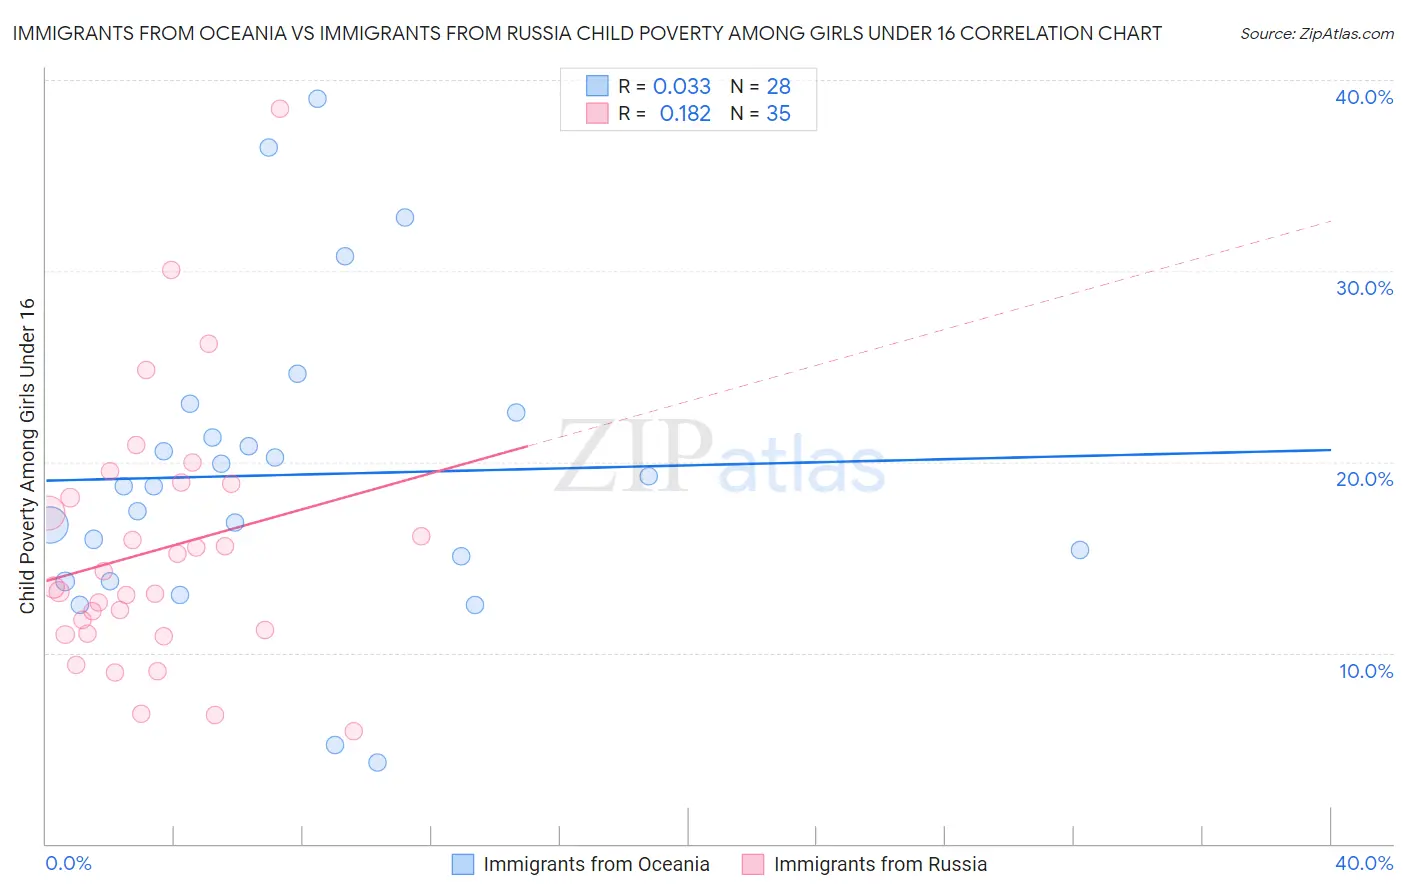
Immigrants from Oceania vs Immigrants from Russia Child Poverty Among Girls Under 16 Correlation Chart

The statistical analysis conducted on geographies consisting of 301,068,502 people shows no correlation between the proportion of Immigrants from Oceania and poverty level among girls under the age of 16 in the United States with a correlation coefficient (R) of 0.033 and weighted average of 16.1%. Similarly, the statistical analysis conducted on geographies consisting of 341,568,734 people shows a poor positive correlation between the proportion of Immigrants from Russia and poverty level among girls under the age of 16 in the United States with a correlation coefficient (R) of 0.182 and weighted average of 14.7%, a difference of 9.9%.
Immigrants from Oceania vs Immigrants from Russia Child Poverty Among Girls Under 16

Child Poverty Among Girls Under 16 Correlation Summary

MeasurementImmigrants from OceaniaImmigrants from Russia
Minimum4.3%5.9%
Maximum39.0%38.5%
Range34.8%32.6%
Mean19.3%15.4%
Median18.7%13.4%
Interquartile 25% (IQ1)14.4%11.0%
Interquartile 75% (IQ3)21.9%18.9%
Interquartile Range (IQR)7.5%7.9%
Standard Deviation (Sample)8.0%6.8%
Standard Deviation (Population)7.9%6.7%

Similar Demographics by Child Poverty Among Girls Under 16

Demographics Similar to Immigrants from Oceania by Child Poverty Among Girls Under 16

In terms of child poverty among girls under 16, the demographic groups most similar to Immigrants from Oceania are French Canadian (16.1%, a difference of 0.050%), Immigrants from Colombia (16.1%, a difference of 0.070%), Immigrants from Germany (16.1%, a difference of 0.14%), South American (16.1%, a difference of 0.16%), and Uruguayan (16.2%, a difference of 0.48%).
DemographicsRating | RankChild Poverty Among Girls Under 16
Immigrants | Fiji
76.1
/100
|
#156
Good
15.9%
Colombians
76.1
/100
|
#157
Good
15.9%
Guamanians/Chamorros
75.3
/100
|
#158
Good
15.9%
Slovaks
75.2
/100
|
#159
Good
15.9%
French
72.8
/100
|
#160
Good
16.0%
Immigrants | Northern Africa
72.0
/100
|
#161
Good
16.0%
French Canadians
68.7
/100
|
#162
Good
16.1%
Immigrants | Oceania
68.4
/100
|
#163
Good
16.1%
Immigrants | Colombia
67.8
/100
|
#164
Good
16.1%
Immigrants | Germany
67.3
/100
|
#165
Good
16.1%
South Americans
67.2
/100
|
#166
Good
16.1%
Uruguayans
64.7
/100
|
#167
Good
16.2%
Yugoslavians
64.4
/100
|
#168
Good
16.2%
Costa Ricans
64.2
/100
|
#169
Good
16.2%
Immigrants | Venezuela
64.2
/100
|
#170
Good
16.2%

Demographics Similar to Immigrants from Russia by Child Poverty Among Girls Under 16

In terms of child poverty among girls under 16, the demographic groups most similar to Immigrants from Russia are Tlingit-Haida (14.7%, a difference of 0.010%), Argentinean (14.7%, a difference of 0.020%), Immigrants from Turkey (14.7%, a difference of 0.030%), Egyptian (14.7%, a difference of 0.040%), and Immigrants from Eastern Europe (14.6%, a difference of 0.15%).
DemographicsRating | RankChild Poverty Among Girls Under 16
Immigrants | Poland
98.2
/100
|
#69
Exceptional
14.6%
Europeans
98.1
/100
|
#70
Exceptional
14.6%
Slovenes
98.1
/100
|
#71
Exceptional
14.6%
Immigrants | Netherlands
98.1
/100
|
#72
Exceptional
14.6%
Immigrants | Austria
98.0
/100
|
#73
Exceptional
14.6%
Taiwanese
98.0
/100
|
#74
Exceptional
14.6%
Immigrants | Eastern Europe
98.0
/100
|
#75
Exceptional
14.6%
Immigrants | Russia
97.9
/100
|
#76
Exceptional
14.7%
Tlingit-Haida
97.9
/100
|
#77
Exceptional
14.7%
Argentineans
97.9
/100
|
#78
Exceptional
14.7%
Immigrants | Turkey
97.9
/100
|
#79
Exceptional
14.7%
Egyptians
97.9
/100
|
#80
Exceptional
14.7%
Ukrainians
97.7
/100
|
#81
Exceptional
14.7%
Macedonians
97.6
/100
|
#82
Exceptional
14.7%
Immigrants | Italy
97.4
/100
|
#83
Exceptional
14.8%